

doi: 10.1016/j.ymeth.2007.02.006.
Implementation of high-content assay for inhibitors of mitogen-activated protein kinase phosphatases
Affiliations
- PMID: 17532514
- PMCID: PMC1950282
- DOI: 10.1016/j.ymeth.2007.02.006
Item in Clipboard
Implementation of high-content assay for inhibitors of mitogen-activated protein kinase phosphatases
Methods.
2007 Jul.
Abstract
Small molecule inhibitors of protein tyrosine kinases have become both powerful chemical probes of biological processes and clinically effective therapeutics. In contrast, few small molecule inhibitors of protein tyrosine phosphatases have been identified and none are currently approved for clinical use. New cell-based high-content methods have been developed that should enable investigators to probe for selective inhibitors of diseases-relevant protein phosphatases. Details of these methods are described herein.
Figures
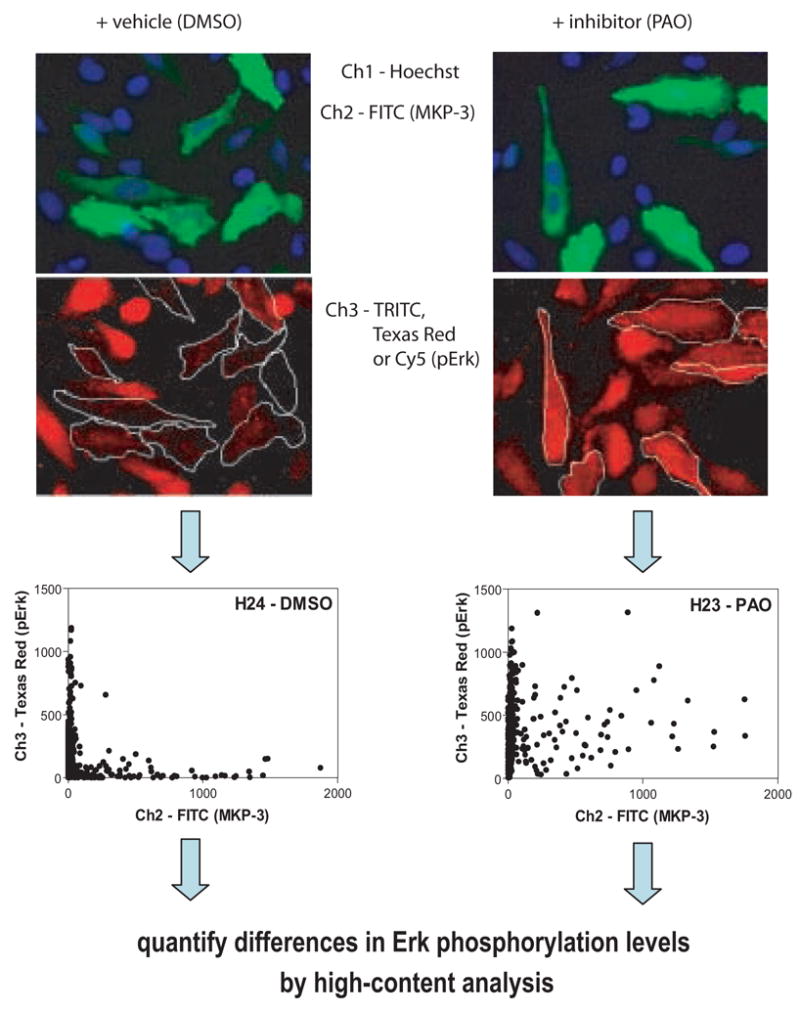
HeLa cells were transfected with c-myc-tagged MKP-3, stimulated with phorbol ester (TPA), treated with vehicle (DMSO) or phenylarsine oxide (PAO) and immunostained simultaneously with anti-c-myc (green) or anti-phospho-Erk (red) antibodies. Plates are analyzed on an ArrayScan II using a triple-band pass filter set. Cellular data from randomly chosen wells are shown as two-dimensional scatter plots with target expression (c-myc-MKP-3) depicted on the x-axis and Erk phosphorylation on the y-axis. In both vehicle-treated and PAO-treated wells, cells with low levels of MKP-3 show a heterogeneous distribution of phospho-Erk that is similar for both conditions. In cells expressing higher levels of MKP-3, phospho-Erk intensities were reduced. Inclusion of the control inhibitor, PAO, elevates phospho-Erk levels in MKP-3 expressing cells to those seen in cells not expressing MKP-3. High-content analysis procedures were developed to quantify differences in Erk phosphorylation between vehicle treated and PAO-treated cells.
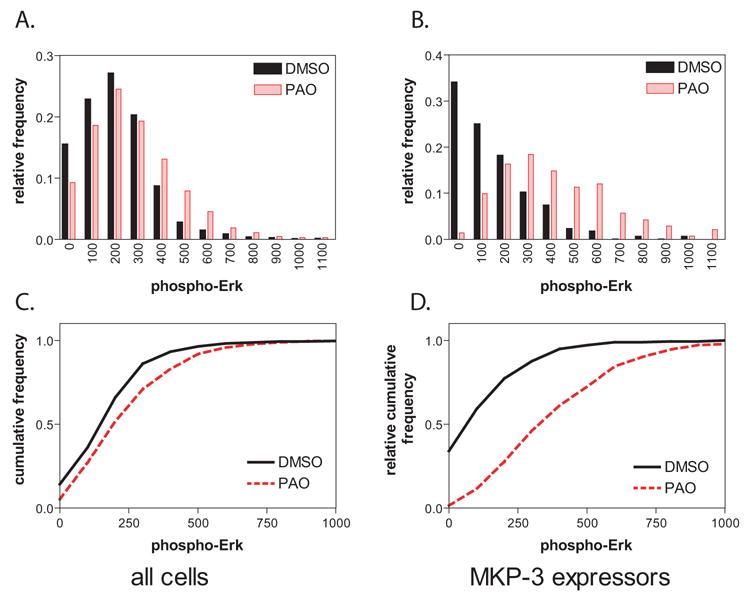
Using the data presented in Figure 1, relative phospho-Erk frequency distributions were established using (A) all cells in the well or (B) only those cells that were classified as MKP-3 positive on the basis of AlexaFluor 488 fluorescence. When using all cells, phospho-Erk distributions are almost identical regardless of treatment. In MKP-3 expressing cells, there is a shift in Erk distribution to higher levels after PAO treatment, although substantial overlap remains. Representing pErk levels as cumulative distributions (C, D) magnifies differences and prepares data for quantification by Kolmogorov-Smirnov (KS) statistics. Solid line, DMSO; dotted line, 5 μM PAO. See text for details on quantitative evaluation.
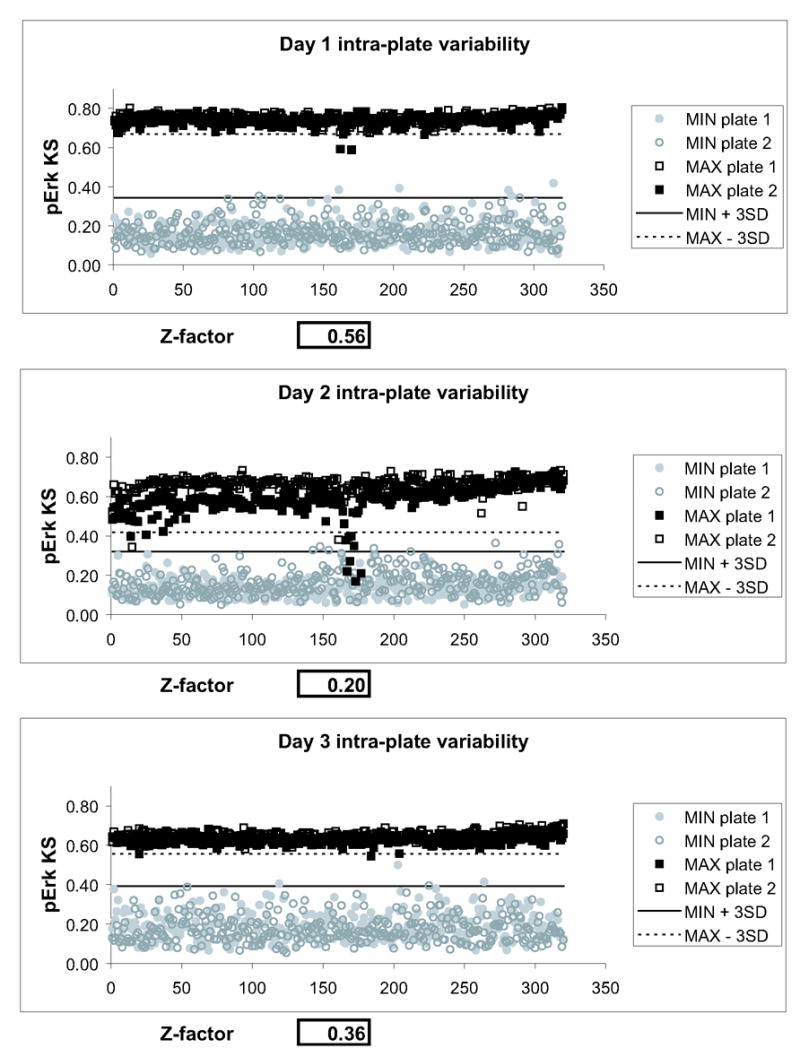
Two plates of minimum (MKP-3 transfected and FITC gated) and maximum (untransfected, ungated) signal were processed on three consecutive days. For each day, minimum and maximum signals from both plates were averaged and Z-factors were calculated. On all three days, the assay showed positive separation bands, as indicated by the solid and dotted lines, which indicate three standard deviations from the means of minimum and maximum signal, respectively. The assay gave Z-factors above 0.2 on all three days. Visual examination of plate graphs demonstrated a systematic error in one of the center rows of plate #1 on day 2, which was due to a clogged dispense nozzle on one of the liquid handlers.
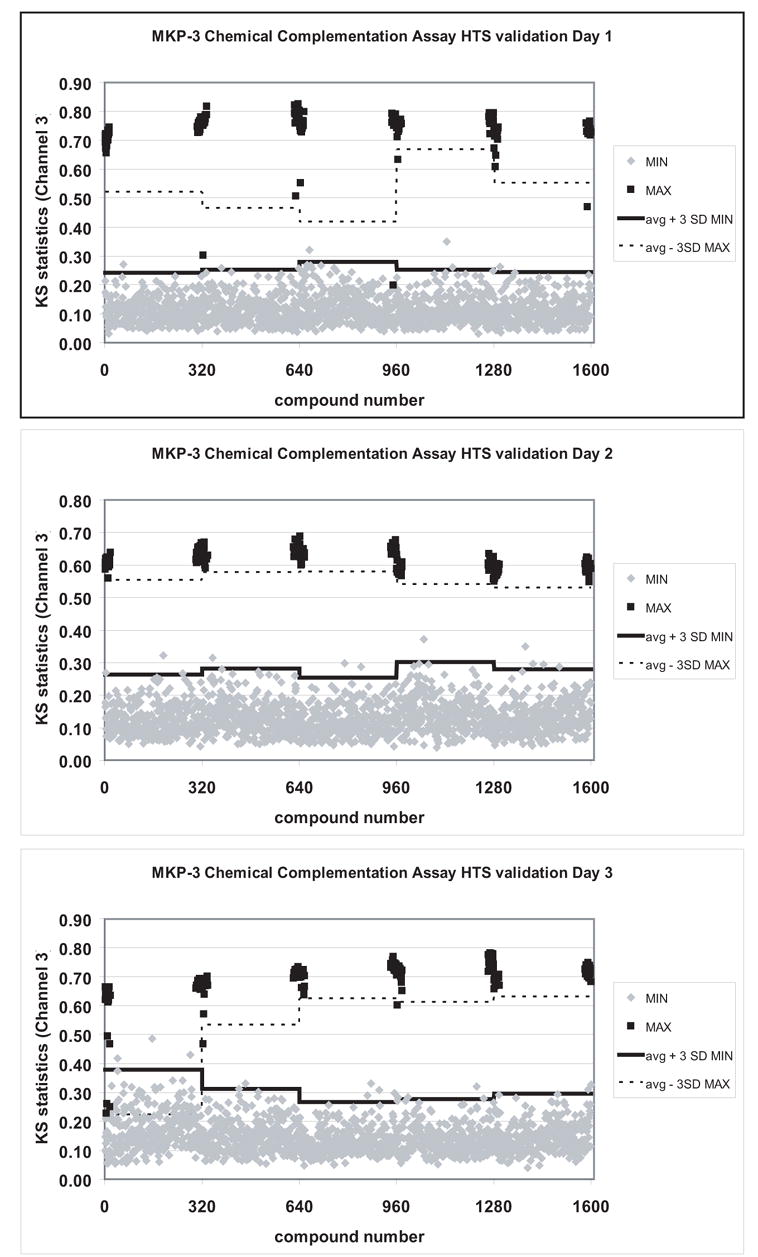
Five 384 well microplates each containing 320 vehicle-controls and 16 positive and negative control wells were run on three separate days. Graphs represent aggregate plate data from each day with positive controls shown as solid black squares. Every plate except one had a positive assay window, with 10/15 plates showing Z-factors above 0.5. Plate failures were due to inconsistencies in positive controls. All outliers were traced to liquid handling inconsistencies, which could be addressed by modification of instrument maintenance routines. None of the plates showed any false positives. Solid line, mean + 3SD of minimum signal, dotted line, mean – 3SD of maximum signal.
References
-
- Keyse SM. Curr Opin Cell Biol. 2000;12:186–192. - PubMed
-
- Farooq A, Zhou MM. Cellular Signalling. 2004;16:769–779. - PubMed
-
- Magi-Galluzzi C, Mishra R, Fiorentino M, Montironi R, Yao H, Capodieci P, Wishnow K, Kaplan I, Stork PJ, Loda M. Lab Invest. 1997;76:37–51. - PubMed
-
- Bang YJ, Kwon JH, Kang SH, Kim JW, Yang YC. Biochem Biophys Res Commun. 1998;250:43–47. - PubMed
-
- Wang H, Cheng Z, Malbon CC. Cancer Lett. 2003;191:229–237. - PubMed
Publication types
MeSH terms
Substances
Grants and funding
LinkOut - more resources
Full Text Sources
Other Literature Sources
Miscellaneous
