

Effects of diffusion weighting schemes on the reproducibility of DTI-derived fractional anisotropy, mean diffusivity, and principal eigenvector measurements at 1.5T
- PMID: 17532649
- PMCID: PMC12008999
- DOI: 10.1016/j.neuroimage.2007.02.056
Effects of diffusion weighting schemes on the reproducibility of DTI-derived fractional anisotropy, mean diffusivity, and principal eigenvector measurements at 1.5T
Abstract
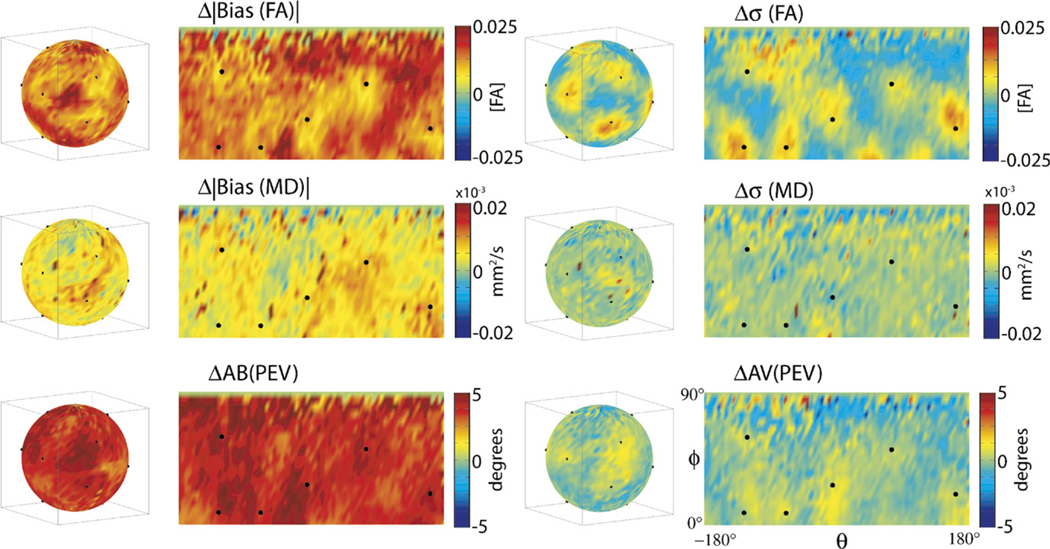
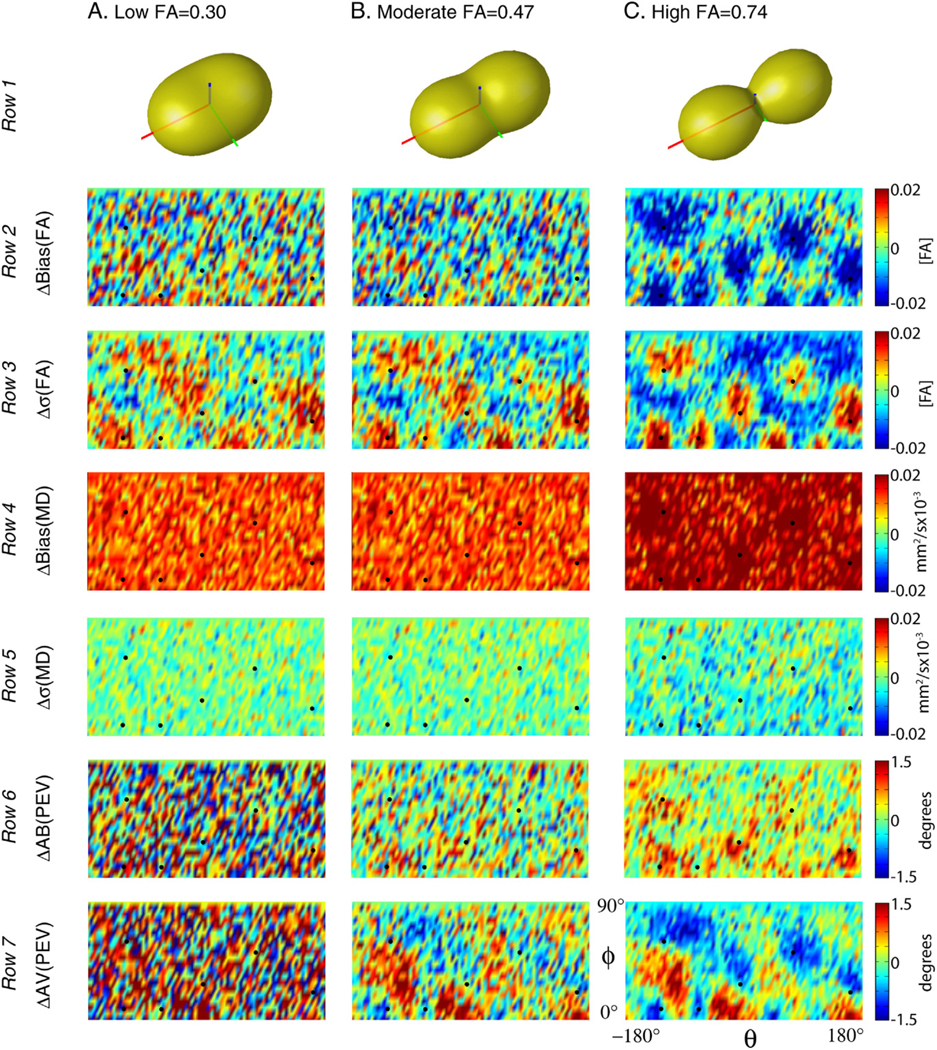
Diffusion tensor imaging (DTI) is used to study tissue composition and architecture in vivo. To increase the signal to noise ratio (SNR) of DTI contrasts, studies typically use more than the minimum of 6 diffusion weighting (DW) directions or acquire repeated observations of the same set of DW directions. Simulation-based studies have sought to optimize DTI acquisitions and suggest that increasing the directional resolution of a DTI dataset (i.e., the number of distinct directions) is preferable to repeating observations, in an equal scan time comparison. However, it is not always clear how to translate these recommendations into practice when considering physiological noise and scanner stability. Furthermore, the effect of different DW schemes on in vivo DTI findings is not fully understood. This study characterizes how the makeup of a DW scheme, in terms of the number of directions, impacts the precision and accuracy of in vivo fractional anisotropy (FA), mean diffusivity (MD), and principal eigenvector (PEV) findings. Orientation dependence of DTI reliability is demonstrated in vivo and a principled theoretical framework is provided to support and interpret findings with simulation results. As long as sampling orientations are well balanced, differences in DTI contrasts due to different DW schemes are shown to be small relative to intra-session variability. These differences are accentuated at low SNR, while minimized at high SNR. This result suggests that typical clinical studies, which use similar protocols but different well-balanced DW schemes, are readily comparable within the experimental precision.
Figures


Similar articles
-
Effects of signal-to-noise ratio on the accuracy and reproducibility of diffusion tensor imaging-derived fractional anisotropy, mean diffusivity, and principal eigenvector measurements at 1.5 T.J Magn Reson Imaging. 2007 Sep;26(3):756-67. doi: 10.1002/jmri.21053. J Magn Reson Imaging. 2007. PMID: 17729339 Free PMC article.
-
Evaluation of measurement uncertainties in human diffusion tensor imaging (DTI)-derived parameters and optimization of clinical DTI protocols with a wild bootstrap analysis.J Magn Reson Imaging. 2009 Feb;29(2):422-35. doi: 10.1002/jmri.21647. J Magn Reson Imaging. 2009. PMID: 19161198
-
Assessing and minimizing the effects of noise and motion in clinical DTI at 3 T.Hum Brain Mapp. 2009 Aug;30(8):2641-55. doi: 10.1002/hbm.20695. Hum Brain Mapp. 2009. PMID: 19086023 Free PMC article.
-
Comparison of diffusion tensor imaging measurements at 3.0 T versus 1.5 T with and without parallel imaging.Neuroimaging Clin N Am. 2006 May;16(2):299-309, xi. doi: 10.1016/j.nic.2006.02.006. Neuroimaging Clin N Am. 2006. PMID: 16731368 Review.
-
Diffusion tensor imaging of the brain.Neurotherapeutics. 2007 Jul;4(3):316-29. doi: 10.1016/j.nurt.2007.05.011. Neurotherapeutics. 2007. PMID: 17599699 Free PMC article. Review.
Cited by
-
Multi-site study of diffusion metric variability: effects of site, vendor, field strength, and echo time on regions-of-interest and histogram-bin analyses.Proc SPIE Int Soc Opt Eng. 2016 Feb 27;9788:97882U. doi: 10.1117/12.2217445. Epub 2016 Mar 29. Proc SPIE Int Soc Opt Eng. 2016. PMID: 27330240 Free PMC article.
-
Diffusion tensor imaging study of brain precentral gyrus and postcentral gyrus during normal brain aging process.Brain Behav. 2020 Oct;10(10):e01758. doi: 10.1002/brb3.1758. Epub 2020 Aug 25. Brain Behav. 2020. PMID: 32844600 Free PMC article.
-
Development of a Sensitive Outcome for Economical Drug Screening for Progressive Multiple Sclerosis Treatment.Front Neurol. 2016 Aug 15;7:131. doi: 10.3389/fneur.2016.00131. eCollection 2016. Front Neurol. 2016. PMID: 27574516 Free PMC article.
-
Short superficial white matter and aging: a longitudinal multi-site study of 1293 subjects and 2711 sessions.Aging Brain. 2023;3:100067. doi: 10.1016/j.nbas.2023.100067. Epub 2023 Jan 16. Aging Brain. 2023. PMID: 36817413 Free PMC article.
-
Mapping the impact of nonlinear gradient fields with noise on diffusion MRI.Magn Reson Imaging. 2023 May;98:124-131. doi: 10.1016/j.mri.2023.01.004. Epub 2023 Jan 9. Magn Reson Imaging. 2023. PMID: 36632947 Free PMC article.
References
-
- Alexander DC, Barker GJ, 2005. Optimal imaging parameters for fiber-orientation estimation in diffusion MRI. NeuroImage 27 (2), 357–367. - PubMed
-
- Altman DG, 1999. Practical Statistics for Medical Research. Chapman and Hall, CRC, New York.
-
- Basser PJ, Pierpaoli C, 1996. Microstructural and physiological features of tissues elucidated by quantitative-diffusion-tensor MRI. J. Magn. Reson., B 111 (3), 209–219. - PubMed
-
- Basser P, Mattiello J, LeBihan D, 1994. Estimation of the effective selfdiffusion tensor from the NMR spin echo. J. Magn. Reson., B 103 (3), 247–254. - PubMed
-
- Batchelor PG, Atkinson D, Hill DL, Calamante F, Connelly A, 2003. Anisotropic noise propagation in diffusion tensor MRI sampling schemes. Magn. Reson. Med 49 (6), 1143–1151. - PubMed
Publication types
MeSH terms
Grants and funding
LinkOut - more resources
Full Text Sources
Other Literature Sources
Research Materials
