. 2007 May-Jun;6(3):205-11.

Nonlinear optical imaging to evaluate the impact of obesity on mammary gland and tumor stroma

Affiliations

Nonlinear optical imaging to evaluate the impact of obesity on mammary gland and tumor stroma

Thuc T Le et al. Mol Imaging. 2007 May-Jun.

Abstract

Obesity is an established risk factor for breast cancer incidence and mortality. However, the mechanism that links obesity to tumorigenesis is not well understood. Here we combined nonlinear optical imaging technologies with an early-onset diet-induced obesity breast cancer animal model to evaluate the impact of obesity on the composition of mammary gland and tumor stroma. Using coherent anti-Stokes Raman scattering and second harmonic generation on the same platform, we simultaneously imaged mammary adipocytes, blood capillaries, collagen fibrils, and tumor cells without any labeling. We observed that obesity increases the size of lipid droplets of adipocytes in mammary gland and collagen content in mammary tumor stroma, respectively. Such impacts of obesity on mammary gland and tumor stroma could not be analyzed using standard two-dimensional histologic evaluation. Given the importance of mammary stroma to the growth and migration of tumor cells, our observation provides the first imaging evidence that supports the relationship between obesity and breast cancer risk.


Figures

Figure 1
Figure 1
Nonlinear optical imaging of mammary gland and tumor stromal composition. A, Adipocytes and blood capillaries (arrows) imaged with coherent anti-Stokes Raman scattering (red) and collagen fibrils imaged with second harmonic generation (SHG) (green) in a mammary gland. B, Blood capillaries and macrophages stained with fluorescein isothiocyanate conjugated isolectin B4 and imaged with two-photon excitation fluorescence (TPEF) (gray). Collagen fibrils was imaged with SHG (green). C, Adipocyte (red) and collagen fibrils (green) organization in a mammary gland. D–F, Organization of tumor cells (red) and collagen fibrils (green) along the vertical axis of a mammary tumor stroma. Images taken with a 60× water immersion objective. Scale bars = 25 µm.
Figure 2
Figure 2
Coherent anti-Stokes Raman scattering imaging of adipocytes (red) and second harmonic generation imaging of collagen fibrils (green) to evaluate the impact of obesity on mammary gland and tumor stromal composition. Representative images (single frames) of (A) a mammary gland of one lean rat chow rat (LRC1), (B–D) mammary tumor stroma of three lean rat chow tumor rats (LRCT1, LRCT2, LRCT3), (E) a mammary gland of one obese Western rat (OW1), and (F–H) mammary tumor stroma of three obese Western tumor rats (OWT1, OWT2, OWT3). Images taken with a 60× water immersion objective. Scale bars = 25 µm.
Figure 3
Figure 3
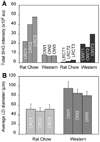
Analysis of the impact of obesity on mammary gland and tumor stromal composition. Mammary gland and tumor tissues of three rats from each animal group were analyzed for collagen content and diameter of lipid droplets (LD) of adipocytes. A, Total second harmonic generation (SHG) collagen intensity in mammary gland and tumor stroma. B, Average diameter of LDs of 100 adipocytes in mammary glands. Error bars represent the standard deviations from the average values.
Figure 4
Figure 4
Coherent anti-Stokes Raman scattering imaging of lipid (red) and second harmonic generation imaging of collagen fibrils (green) of standard histologic tissue sections. Histology of the mammary gland of (A) a lean rat chow rat (LRC), (B) an obese Western rat (OW), and the mammary tumors of (C) a lean chow tumor rat (LRCT) and (D) an obese Western tumor rat (OWT). Images taken with a 20× air objective. Scale bars = 75 µm.

Similar articles

Cited by

References

    1. Marx J. Unraveling the causes of diabetes. Science. 2002;296:686–689. - PubMed
    1. Lorincz AM, Sukumar S. Molecular links between obesity and breast cancer. Endocr Relat Cancer. 2006;13:279–292. - PubMed
    1. Barnett JB. The relationship between obesity and breast cancer risk and mortality. Nutr Rev. 2003;61:73–76. - PubMed
    1. Narod S, Lynch H, Conway T, et al. Increasing incidence of breast-cancer infamily with Brcal mutation. Lancet. 1993;341:1101–1102. - PubMed
    1. Bissell MJ, Radisky D. Putting tumours in context. Nat Rev Cancer. 2001;1:46–54. - PMC - PubMed

Publication types

MeSH terms

LinkOut - more resources