

3D maps from multiple MRI illustrate changing atrophy patterns as subjects progress from mild cognitive impairment to Alzheimer's disease
- PMID: 17533169
- PMCID: PMC2752411
- DOI: 10.1093/brain/awm112
3D maps from multiple MRI illustrate changing atrophy patterns as subjects progress from mild cognitive impairment to Alzheimer's disease
Abstract
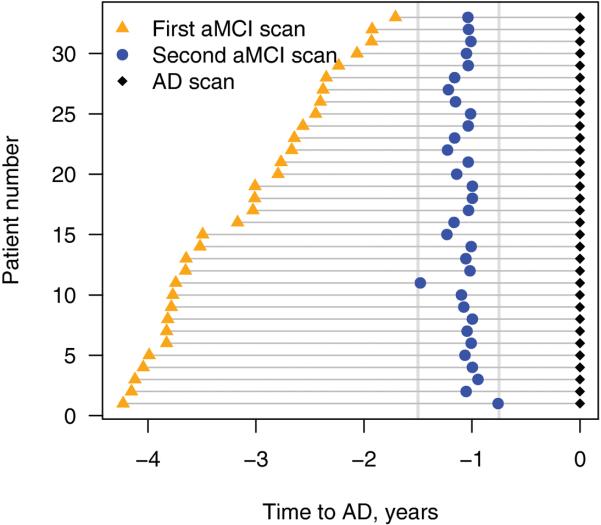
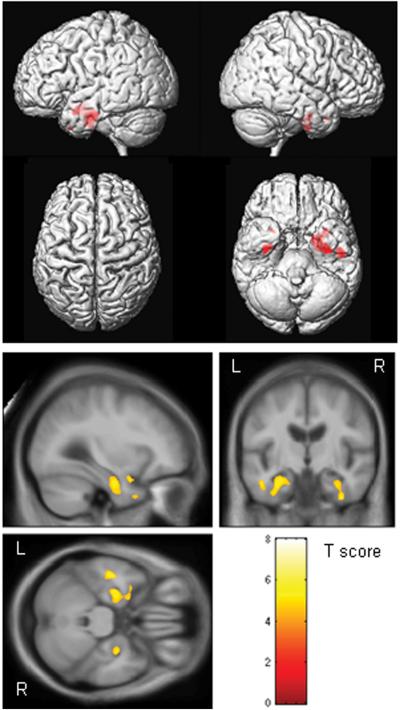
Mild cognitive impairment (MCI), particularly the amnestic subtype (aMCI), is considered as a transitional stage between normal aging and a diagnosis of clinically probable Alzheimer's disease (AD). The aMCI construct is particularly useful as it provides an opportunity to assess a clinical stage which in most subjects represents prodromal AD. The aim of this study was to assess the progression of cerebral atrophy over multiple serial MRI during the period from aMCI to progression to AD. Thirty-three subjects were selected that fulfilled clinical criteria for aMCI and had three serial MRI scans: the first scan approximately 3 years before the diagnosis of AD, the second scan approximately 1 year before, and the third scan at the time of the diagnosis of AD. A group of 33 healthy controls were age and gender-matched to the study cohort. Voxel-based morphometry (VBM) was used to assess patterns of grey matter atrophy in the aMCI subjects at each time-point compared to the control group. Customized templates and prior probability maps were used to avoid normalization and segmentation bias. The pattern of grey matter loss in the aMCI subject scans that were 3 years before the diagnosis of AD was focused primarily on the medial temporal lobes, including the amygdala, anterior hippocampus and entorhinal cortex, with some additional involvement of the fusiform gyrus, compared to controls. The extent and magnitude of the cerebral atrophy further progressed by the time the subjects were 1 year before the diagnosis of AD. At this point atrophy in the temporal lobes spread to include the middle temporal gyrus, and extended into more posterior regions of the temporal lobe to include the entire extent of the hippocampus. The parietal lobe also started to become involved. By the time the subjects had progressed to a clinical diagnosis of AD the pattern of grey matter atrophy had become still more widespread with more severe involvement of the medial temporal lobes and the temporoparietal association cortices and, for the first time, substantial involvement of the frontal lobes. This pattern of progression fits well with the Braak and Braak neurofibrillary pathological staging scheme in AD. It suggests that the earliest changes occur in the anterior medial temporal lobe and fusiform gyrus, and that these changes occur at least 3 years before progression to the diagnosis of AD. These results also suggest that 3D patterns of grey matter atrophy may help to predict the time to the first diagnosis of AD in subjects with aMCI.
Figures


References
-
- Adak S, Illouz K, Gorman W, Tandon R, Zimmerman EA, Guariglia R, et al. Predicting the rate of cognitive decline in aging and early Alzheimer disease. Neurology. 2004;63:108–14. - PubMed
-
- Ashburner J, Friston KJ. Voxel-based morphometry--the methods. Neuroimage. 2000;11:805–21. - PubMed
-
- Baron JC, Chetelat G, Desgranges B, Perchey G, Landeau B, de la Sayette V, et al. In vivo mapping of gray matter loss with voxel-based morphometry in mild Alzheimer's disease. Neuroimage. 2001;14:298–309. - PubMed
-
- Bell-McGinty S, Lopez OL, Meltzer CC, Scanlon JM, Whyte EM, Dekosky ST, et al. Differential cortical atrophy in subgroups of mild cognitive impairment. Arch Neurol. 2005;62:1393–7. - PubMed
-
- Bottino CM, Castro CC, Gomes RL, Buchpiguel CA, Marchetti RL, Neto MR. Volumetric MRI measurements can differentiate Alzheimer's disease, mild cognitive impairment, and normal aging. Int Psychogeriatr. 2002;14:59–72. - PubMed
Publication types
MeSH terms
Grants and funding
LinkOut - more resources
Full Text Sources
Other Literature Sources
Medical
