

Measurement of the interplay effect in lung IMRT treatment using EDR2 films
- PMID: 17533350
- PMCID: PMC5722391
- DOI: 10.1120/jacmp.v7i4.2222
Measurement of the interplay effect in lung IMRT treatment using EDR2 films
Abstract
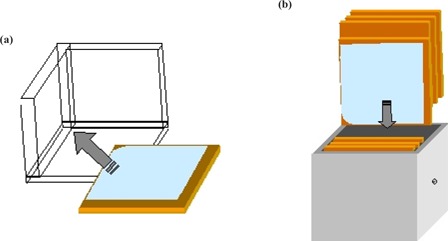
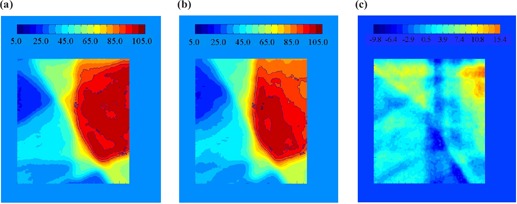
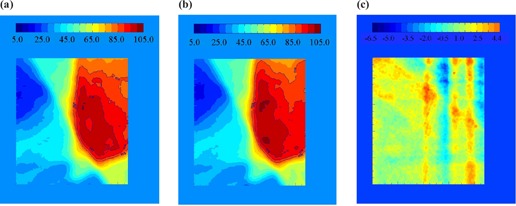
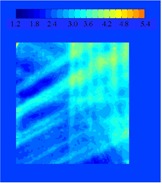
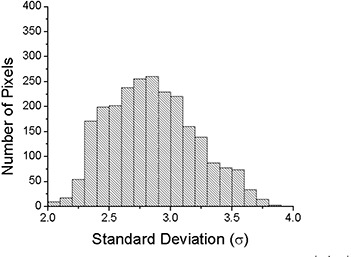
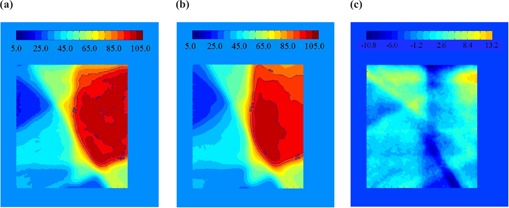
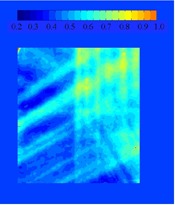
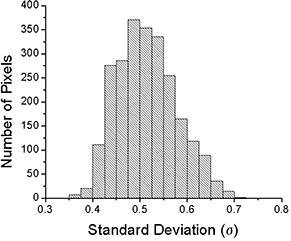
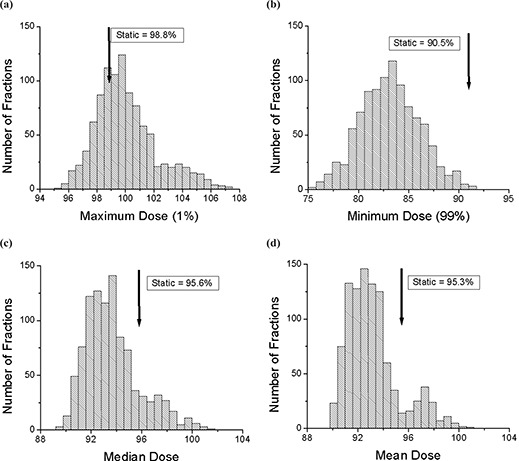
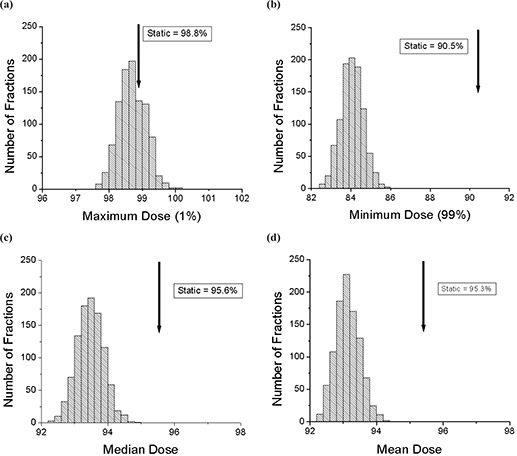
Intra-fraction organ motion during the dynamic delivery of IMRT treatment of lung tumors may cause unexpected hot/cold spots even within the target volume, due to the interplay effect between tumor motion and multi-leaf collimator (MLC) leaf motion. In the past, this has been investigated through theoretical analysis, computer simulation, and experimental measurement using an ionization chamber dosimeter. In the work presented here, the interplay effect was studied experimentally in 2D, using Kodak EDR2 films. A five-field lung IMRT plan was delivered to a solid water phantom with embedded film. The phantom was placed on a motor-driven platform with a sinusoidal motion to simulate the respiration induced tumor motion. The delivery of each field began at one of eight equally spaced initial breathing phases. The dose distribution for each treatment fraction was estimated by combining the dose distributions for all fields with randomly sampled initial breathing phases. The dose variation caused by the interplay effect was estimated by looking at the dose values from 1000 trials of 30 fractions. It was found that, on a day-to-day basis, the standard deviation of the dose to a given pixel in the high dose region could be as high as 2-3% due to the motion interplay effect. After thirty fractions, the standard deviation in the dose to each pixel is reduced to about 0.3-0.5%. However, compared to the static delivery, the dose distribution from a thirty-fraction case in the presence of motion shows some under-dosing in the region of interest. Our results indicate that the interplay effect is of no significant consequence to tumor dose coverage in lung IMRT delivery over the entire course of a thirty-fraction treatment.
Figures
References
-
- Marnitz S, Stuschke M, Bohsung J, et al. Intraindividual comparison of conventional three‐dimensional radiotherapy and intensity modulated radiotherapy in the therapy of locally advanced non‐small cell lung cancer a planning study. Strahlenther Onkol. 2002; 178 (11): 651–658. - PubMed
-
- Intensity modulated radiation therapy collaborative working group . Intensity‐modulated radiotherapy: Current status and issues of interest. Int J Radiat Oncol Biol Phys. 2001; 51 (4): 880–914. - PubMed
-
- Bortfeld T, Jiang SB, Rietzel E. Effects of motion on the total dose distribution. Semin Radiat Oncol. 2004; 14 (1): 41–51. - PubMed
-
- Zelefsky MJ, Fuks Z, Leibel SA. Intensity‐modulated radiation therapy for prostate cancer. Semin Radiat Oncol. 2002; 12 (3): 37. - PubMed
-
- Choi NC, Fischman AJ, Niemierko A, et al. Dose‐response relationship between probability of pathologic tumor control and glucose metabolic rate measured with FDG PET after preoperative chemoradiotherapy in locally advanced non‐small‐cell lung cancer. Int J Radiat Oncol Biol Phys. 2002; 54 (4): 35. - PubMed
Publication types
MeSH terms
LinkOut - more resources
Full Text Sources
Medical
Miscellaneous
