. 2007 May 30;2(5):e471.
doi: 10.1371/journal.pone.0000471.

Regulation of plant developmental processes by a novel splicing factor

Affiliations

Regulation of plant developmental processes by a novel splicing factor

Gul Shad Ali et al. PLoS One. .

Abstract

Serine/arginine-rich (SR) proteins play important roles in constitutive and alternative splicing and other aspects of mRNA metabolism. We have previously isolated a unique plant SR protein (SR45) with atypical domain organization. However, the biological and molecular functions of this novel SR protein are not known. Here, we report biological and molecular functions of this protein. Using an in vitro splicing complementation assay, we showed that SR45 functions as an essential splicing factor. Furthermore, the alternative splicing pattern of transcripts of several other SR genes was altered in a mutant, sr45-1, suggesting that the observed phenotypic abnormalities in sr45-1 are likely due to altered levels of SR protein isoforms, which in turn modulate splicing of other pre-mRNAs. sr45-1 exhibited developmental abnormalities, including delayed flowering, narrow leaves and altered number of petals and stamens. The late flowering phenotype was observed under both long days and short days and was rescued by vernalization. FLC, a key flowering repressor, is up-regulated in sr45-1 demonstrating that SR45 influences the autonomous flowering pathway. Changes in the alternative splicing of SR genes and the phenotypic defects in the mutant were rescued by SR45 cDNA, further confirming that the observed defects in the mutant are due to the lack of SR45. These results indicate that SR45 is a novel plant-specific splicing factor that plays a crucial role in regulating developmental processes.


Conflict of interest statement

Competing Interests: The authors have declared that no competing interests exist.

Figures

Figure 1
Figure 1. Arabidopsis SR45 is a splicing factor.
(A) Alignment of SR45 amino acid sequences from Arabidopsis (AtSR45, At1g16610), rice (RiceSR45_1, Accession AK070420; RiceSR45_2, Accession AK063761) and maize (MaizeSR45, Accession BT016650). The RRM domain is underscored and the RS domains at the N-and C-terminus are indicated by dashed underlines. Identical amino acids are shown by reverse lettering. Dashes indicate gaps in alignment. (B) In vitro splicing of β-globin pre-mRNA in S100 cell extract supplemented with either 25 ng of ASF/SF2 (ASF) or increasing amounts (10, 30 and 90 ng) of purified SR45 (SR45) expressed in insect cells. The positions of pre-mRNA, spliced mRNA and 5′ exon are indicated to the right of the blot. Boxes and a line indicate exons and an intron, respectively.
Figure 2
Figure 2. Molecular characterization of sr45-1plants.
(A) Gene structure of SR45 (At1g16610). Filled rectangles are exons; thin lines are introns; inverted open triangle indicates the position of the T-DNA insertion in the 7th exon. The location of various primers used in PCR is indicated by half-head arrows. The schematic diagram below the gene structure shows domain organization of SR45 protein. The corresponding gene positions coding for the N-terminal arginine/serine rich (RS1) domain, the middle RNA recognition motif (RRM) and the C-terminal RS2 domain are indicated by downward arrows. (B) Verification of the sr45-1 insertion in the genomic DNA by PCR with SR45-specific primers (LP and RP) and the T-DNA-specific primer LBb1; the locations of these primers relative to the T-DNA insertion are shown in (A). (C) Southern blot showing single insertion of T-DNA. Genomic DNA from WT and sr45-1 was digested with either SacI or EcoRI and probed with a 32P-labeled T-DNA probe. (D) RT-PCR expression analyses of SR45 in WT and sr45-1 plants using SR45-specific primers (1F and 414R, which will amplify full-length SR45; 1F and 172R will amplify a truncated SR45 transcript before the T-DNA insertion). Cyc, cyclophilin product was amplified to show equal amount of cDNA template in PCR. PCR product in WT and sr45-1 was normalized to cyclophilin expression in WT and sr45-1, respectively. Numbers below each panel indicate the level of transcript in WT and sr45-1 plants. The level of SR45 transcript in WT is considered as 1.
Figure 3
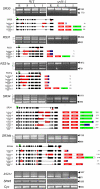
Figure 3. Expression and alternative splicing of pre-mRNAs of Arabidopsis SR genes in different organs is altered in the sr45-1 plants.
Expression levels were analyzed by RT-PCR with primers specific to each SR gene. Sequences of forward and reverse primers used are shown in Table S3. An equal amount of template in each reaction was verified by amplifying a constitutively expressed cyclophilin. The name of the SR gene is shown on the left of each panel. DNA sizes are indicated on the right. Isoform number is indicated on the left side of the gel. R, root; S, stem; L, leaf and I, inflorescence. Schematic diagrams in the bottom panel for each gene show the gene structure and its alternatively spliced mRNA isoforms (Numbers below each isoform indicate the number of nucleotides). Predicted proteins from splice variants are shown to the right of each isoform. Exons are filled rectangles and introns are thin lines. Black rectangles represent constitutively spliced exons whereas the red rectangles indicate the included regions in splice variants. Vertical arrowhead and ‘*’ show start and stop codons, respectively; Horizontal green and red arrowheads above and below gene structures indicate the position of forward and reverse primers, respectively. In the schematics of predicted proteins, numbers to the right are the number of amino acids in the protein. RRM, RNA recognition motif, RS, Arginine/Serine-rich domain. Blue rectangle indicates a stretch of amino acids that are not present in functional SR proteins.
Figure 4
Figure 4. Phenotypic characterization of sr45-1plants.
(A–D) Phenotypes of sr45-1 at different growth stages grown under long-days (16-h photoperiod). WT plants are shown on the left side and sr45-1 plants are on the right side of each panel. (A) Eight day-old seedlings on MS plates; Note that sr45-1 has narrow true leaves. (B) Twenty-day-old plants in the soil; several leaves in the sr45-1 plant are curled downward and inward, indicated by arrow-heads. Inset graph in (B) shows the size of sr45-1 compared to WT. (C) Thirty-five-day old plants in soil. (D) Fifty-four-day-old plants in soil; note that WT has completed flowering and most of the siliques have turned brown, whereas, the sr45-1 plant is still flowering. (E) Root growth in sr45-1 and WT plants. A representative photograph of sr45-1 and WT seedlings (27 days after germination) illustrates reduced root growth. (F) Quantification of root growth. Each data point is the mean±SEM of 5 plants.
Figure 5
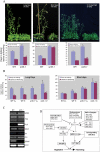
Figure 5. sr45-1 plants are late flowering.
(A) Top panel: sr45-1 plants are considerably later flowering than WT under long-day (LD, 16 h∶8 h light∶dark), short-day (SD, 8 h∶16 h light∶dark) and 12 h∶12 h light∶dark conditions. Age of the plants at the time they were photographed is indicated on each panel. Bottom Panel: Quantification of flowering time. Transition to reproductive stage was measured as days to bolting and number of rosette leaves at the appearance of 1st flower. Each bar is the mean±SEM of 48 to 72 plants. Significant differences (p<0.05) between WT and sr45-1 plants are indicated by ‘*’. Each experiment was repeated three times. (B) Effect of vernalization on flowering of sr45-1 plants. sr45-1 and WT seeds were stratified at 4°C for 2 days or vernalized for 40 days at 4°C and grown under LD (16 h photoperiod) or SD (8 h photoperiod) conditions in soil. Flowering time was measured as described in experimental procedures. V+and V-indicate vernalized and unvernalized plants, respectively. Significant differences (p<0.05) between vernalized and unvernalized plants are indicated by ‘*’. Each experiment was repeated three times. (C) Expression analyses of flowering related genes in sr45-1 and WT plants. Expression of representative genes in various flowering pathways was analyzed by RT-PCR. VRN2 belongs to the vernalization pathway, FCA to the autonomous pathway; FLC integrates signals from these two pathways. CO belongs to the photoperiod pathway. SOC1 and FT function downstream of FLC. Each RT-PCR was repeated at least three times. (D) Expression levels of various genes in the flowering time pathways of Arabidopsis. Model is adapted from , . Value in parentheses next to a gene indicates induction or repression of that gene in sr45-1. NC, No change.
Figure 6
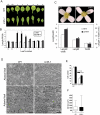
Figure 6. sr45-1 plants have elongated leaves and petals.
(A) WT and sr45-1 plants grown on MS plates. Note that sr45-1 has elongated leaves. Cotyledonary leaves (C1 and C2) and true leaves are numbered from left (older) to right (younger). (B) Leaf length/width ratios (Mean±SEM) of WT and sr45-1 plants. (n = 11 leaves from 11 plants, Student's t-test p-values are as follows: Cotyledon (C1), p = 0.52; Cotyledon (C2), p = 0.39; leaf 1, p = 0.002; leaf 2, p = 0.021; leaf 3, p = 0.022; leaf 4, p = 0.0003; leaf 5, p = 0.33; leaf 6, p = 0.49; leaf 7, p = 0.29). The symbol ‘*’ on the top of bars indicate that the difference between WT and sr45-1 is significant (p<0.05). (C) Fully opened flowers of sr45-1 plants have elongated petals. The bottom panel shows quantification of length, width and length/width ratio (Mean±SEM) of petals in WT (WT) and mutant (sr45-1) plants (n = 16, Student's t-test p-values: length, p = 10−9, width, p = 10−8 ;length/width p = 10−10). The symbol ‘*’ on the top of bars indicate that the difference between WT and sr45-1 is significant (p<0.05). (D) The leaves of sr45-1 plants exhibit abnormal expansion of pavement cells. Scanning electron micrographs of the abaxial and adaxial surfaces of WT and sr45-1 plants. Note the presence of abnormal elongated abaxial pavement cells in sr45-1. For clarity, the boundaries of pavement cells on the adaxial surfaces are outlined. Note the presence of markedly enlarged and elongated pavement cells in sr45-1 leaves. Bars = 50 µm. (E) Quantitative analyses of the number of pavement cells and stomata in WT and sr45-1. Each bar is the average±SEM of cells counted in at least three 160 mm2 areas in three different leaves. The p-values of the t-test statistics of pavement cell and stomata were 0.55 (non-significant) and 0.03 (significant, indicated by ‘*’), respectively. (F) Box plots of the distribution of cell sizes in WT and sr45-1 pavement cells. Each box plot was made from the cell sizes of WT (n = 112) and sr45-1 (n = 128) from at least three different leaves. Boxes indicate the interquartile range between the 1st and 3rd quartile, whereas line in the middle of the box represents median. Ends of the vertical lines indicate the range of the data.
Figure 7
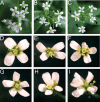
Figure 7. sr45-1 Flowers have Altered Number of Sepals and Petals.
(A) WT inflorescence shows that all flowers had four petals. (B and C) Inflorescences from two separate sr45-1 plants are shown. Each panel shows 3 of 6 flowers with abnormal petal and stamen numbers, indicated by arrowhead. (D) Close-up of a WT flower with 4 petals 6 stamens. (E–I) sr45-1 flowers with abnormal petal and stamen numbers. Number of sepals and carpels were not changed. (E) 4 petals 5 stamens (F) 5 petals 5 stamens (G) 6 petals 3 stamens (H) 6 petals 4 stamens (I) 8 petals 3 stamens.
Figure 8
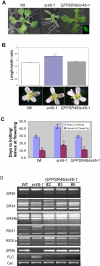
Figure 8. Full-length GFP-tagged SR45 rescued the mutant phenotypes of sr45-1 plants.
(A) Growth of WT, sr45-1 and GFP-SR45/sr45-1 plants. The narrow-leaf and stunted growth phenotype of sr45-1 was rescued by expression of GFP-SR45 in sr45-1 plants. Inset in the lower right corner shows a root epidermal nucleus of a GFP-SR45/sr45-1 displaying the characteristic speckled distribution of GFP-SR45. (B) Petal shape phenotype of WT, sr45-1 and GFP-SR45/sr45-1. The p-values of t-test statistics are as follows: WT vs sr45-1, p = 0.000012 (significant); WT vs GFPSR45/sr45-1, p = 0.32 (non-significant). Significant difference is indicated by ‘*’. (C) Quantification of flowering time. Transition to reproductive stage was measured as days to bolting and number of rosette leaves at the appearance of 1st flower. Each bar is the mean±SEM of 10 to 22 plants. Bars with same letter and the same color indicate non-significant difference (p>0.05). (D) Expression pattern of alternatively spliced transcripts of SR genes in WT, sr45-1 and GFP-SR45/sr45-1 plants. Expression pattern of three independent GFP-SR45/sr45-1 lines is shown. In all transgenic lines the splicing patterns of pre-mRNAs encoding SR proteins is restored to wild-type. Similar results were obtained in two independent RT-PCR analyses. For details on RT-PCR and primer sets used see Figure 3. Cyclophilin amplification was used to demonstrate equal amount of template in each PCR.

References

    1. Reddy AS. Alternative Splicing of Pre-Messenger RNAs in Plants in the Genomic Era. Annu Rev Plant Biol. 2007;58:267–294. - PubMed
    1. Huang Y, Steitz JA. SRprises along a messenger's journey. Mol Cell. 2005;17:613–615. - PubMed
    1. Graveley BR. Sorting out the complexity of SR protein functions. RNA. 2000;6:1197–1211. - PMC - PubMed
    1. Sanford JR, Longman D, Caceres JF. Multiple roles of the SR protein family in splicing regulation. In: Jeanteur P, editor. Regulation of alternative splicing. New York: Springer; 2003. pp. 33–58. - PubMed
    1. Reddy ASN. Nuclear pre-mRNA splicing in plants. CRC Crit Rev Plant Sci. 2001;20:523–572.

Publication types