. 2007 May 30;2(5):e472.
doi: 10.1371/journal.pone.0000472.

Short RNA guides cleavage by eukaryotic RNase III

Affiliations

Short RNA guides cleavage by eukaryotic RNase III

Bruno Lamontagne et al. PLoS One. .

Abstract

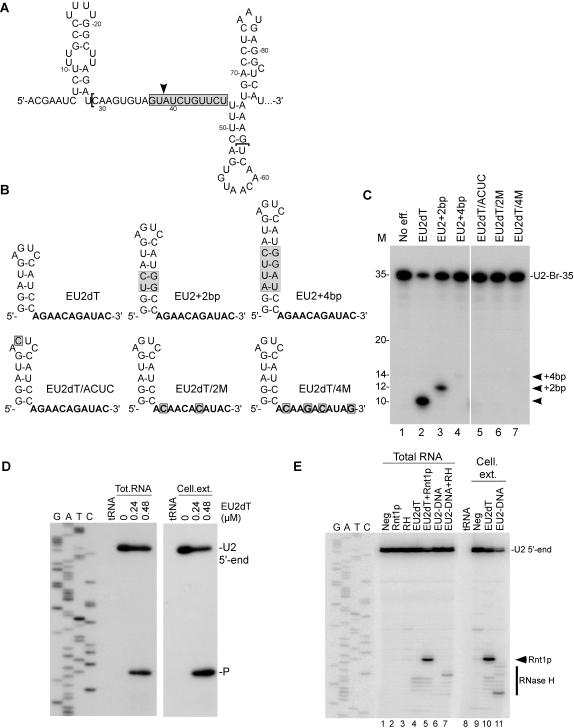
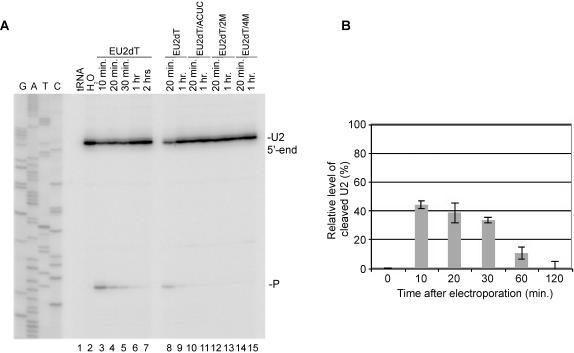
In eukaryotes, short RNAs guide a variety of enzymatic activities that range from RNA editing to translation repression. It is hypothesized that pre-existing proteins evolved to bind and use guide RNA during evolution. However, the capacity of modern proteins to adopt new RNA guides has never been demonstrated. Here we show that Rnt1p, the yeast orthologue of the bacterial dsRNA-specific RNase III, can bind short RNA transcripts and use them as guides for sequence-specific cleavage. Target cleavage occurred at a constant distance from the Rnt1p binding site, leaving the guide RNA intact for subsequent cleavage. Our results indicate that RNase III may trigger sequence-specific RNA degradation independent of the RNAi machinery, and they open the road for a new generation of precise RNA silencing tools that do not trigger a dsRNA-mediated immune response.


Conflict of interest statement

Competing Interests: For clarity and transparency we declare a potential duality of interest because we have submitted a patent covering this discovery. However, there is no value for this primary patent submission and we have no reason to believe at this time that the publication will affect neither the potential nor value of the potential patent.

Figures

Figure 1
Figure 1. Rnt1p does not require a complete A-form helix for cleavage.
(A) Schematic representations of Rnt1p substrates used in B and C. U2C, U2LE, and U2RI were derived from Rnt1p cleavage site at the 3′-end of U2 snRNA. EL18-18, EL18-15, EL18/5′, and EL18/3′ are derived from the cleavage site at the 3′ end of U5 snRNA. The arrowheads indicate major Rnt1p cleavage sites. (B) and (C) The different 5′-end labeled substrates were incubated in the absence (N) or presence of recombinant Rnt1p. Cleavage was carried out either in enzyme excess to measure the single turnover rate (ST) or in RNA excess to measure the multiple turnover rate (MT). The cleavage products were fractionated by 20% denaturing PAGE and visualized by autoradiogram. The cleavage efficiencies are presented as fractional velocities relative to the parental substrate. The values reflect the average of three independent experiments. The RNA marker (M) is indicated on the left. The positions of the cleavage products (P) and the substrates (S) are indicated by arrowheads on the right.
Figure 2
Figure 2. Rnt1p cleaves intermolecular RNA substrates.
Illustrations of an RNA guide that could be cleaved by Rnt1p (EL18-15) (A) or a guide that cannot be cleaved by Rnt1p (EL9-11) (B) when in complex with the target RNA (TL). The arrowheads indicate the positions of the observed cleavage sites within the guide and target sequences. (C) and (D) illustrate the gel shift assay used to monitor the interaction of EL18-15 and EL9-11 with the target sequence (TL). The reaction products were loaded on a 12% non-denaturing PAGE. The complex formation was quantified using the Instant Imager and the average percent shift (%) obtained from two independent experiments is indicated below each gel. The complexes are indicated on the right. RNA cleavage was assayed using EL18-15 (E) or EL9-11 (F). The RNA was incubated with different ratios of 5′-end labeled target (TL) and two different Rnt1p concentrations (20 and 80 nM) for 20 minutes. The cleavage products were analyzed by 20% denaturing PAGE and the bands were quantified using Instant Imager. Average percent (%) cleavage of three independent experiments is indicated below each gel. The RNA marker is displayed on the left. The positions of the substrate (S) and product (P) are showed on the right.
Figure 3
Figure 3. Comparison between inter- and intra-molecular RNA cleavage by different RNase IIIs.
(A) Illustration of the different substrates used in C and D. 3′-Branch indicates a substrate allowing intramolecular cleavage by Rnt1p. EL3′-11 and EL9-11 indicate respectively a guide RNA with a single or two target complementary extensions. The target is indicated by TL. The arrowheads indicate the position of the observed cleavage by Rnt1p. (B) Quantitative analysis of RNA binding to Rnt1p. Increasing concentrations of Rnt1p (0.25 to 6 µM) were incubated with 3 fmol of 3′-Branch (▪), EL9-11:TL (σ) and EL3′-11:TL (τ) and the binding percentage (%) was plotted against the protein concentration. The curve fits were obtained using the Graph Pad Prism 4.0 program. Each data point is an average of four experiments. The target RNA in the trans reactions and the cis RNA were 5′-end labeled and incubated with members of the RNase III family. Rnt1p, bacterial RNase III (RIII), Pac1 and human Dicer were incubated in RNA excess under a 10 mM (C) or 150 mM (D) KCl. The position of the RNA ladder is shown on the left. (E) Sketch of a 36 nt fragment containing sequences complementary to EL3′-11 inserted into a U2 3′-end flanking region to replace a canonical Rnt1p substrate. The position of the oligonucleotide used for primer extension is indicated. (F) Mapping the cleavage of the U2 3′-end region with RNase IIIs. Yeast total RNA (20µg) from YHM111-U2L2 was incubated with EL3′-11 and RNase IIIs in 10 and 150 mM KCl. A primer complementary to the 3′-flanking sequence of U2 snRNA was extended in all cleavage reactions. The reference DNA sequence is shown on the left. The arrowhead indicates a specific cleavage product. The asterisk indicates a secondary structure at the mature U2 3′-end.
Figure 4
Figure 4. Guide RNA restored cleavage to a mutated Rnt1p cleavage site in vivo.
(A) Secondary structure of RNA guides complementary to a mutated Rnt1p cleavage site at the 3′-end of U2 snRNA (L2). The position of the oligonucleotide used for primer extension is indicated below as well as putative poly(A) signals (+96, +117, and +306). (B) RNA guides were incubated in yeast extract or with yeast total RNA and recombinant Rnt1p for 20 min. The cleavage site was mapped using primer complementary to the 3′-flanking sequence of U2 snRNA. The reference DNA sequence produced using the same primer is shown on the left. The product corresponding to the cleaved RNA is indicated. Bacterial tRNA was used as negative control for the primer extension. (C) Yeast strain YHM111-U2L2 was electroporated with EL3′-11dT and the RNA extracted after 10 minutes of incubation. The RNA bands were analyzed by northern blot using a probe complementary to mature U2 snRNA sequence. A probe directed against RPR1 was used as loading control. The arrowhead indicates the position of the cleavage product. (D) Cleavage site mapping of yeast YHM111-U2L2 electroporated with EL3′-11dT. Total RNA was extracted between 10 minutes and 2 hours post-electroporation and annealed to the primer used in B. The reference DNA sequence is shown on the left. The product corresponding to the cleaved RNA is indicated. (E) Analysis of U2 snRNA 3′-end formation. RNA samples described in D were hybridized to an RNA probe (DraI-SmaI fragment) complementary to the 3′- flanking sequences of U2 snRNA, and digested with RNase T1. The mature U2 3′-end and the ends of the extended forms are indicated on the right. The Rnt1p-directed cleavage product is indicated by an arrowhead. The position of the different 3′-ends detected is indicated using wild-type U2 sequence as reference. A probe against actin was used as internal control for loading and quantification.
Figure 5
Figure 5. Guide RNA directs sequence specific cleavage in a natural RNA sequence.
(A) Secondary structure of the U2 snRNA branch site region (nucleotides 1 to 86). The gray box, the arrowhead and the brackets represent respectively the targeted region by Rnt1p, the anticipated cleavage site by Rnt1p and the region used for in vitro cleavage assays (U2-Br-35). (B) Sketches representing the secondary structure of guides recognized by Rnt1p and complementarity to the U2 branch site. Sequences in bold represent the nucleotides complementary to the U2 target. The gray boxes indicate mutations relative to the control (EU2dT). (C) In vitro cleavage of 5′-end labeled U2-Br-35 with Rnt1p and the different RNA guides. The cleavage reactions were performed in RNA excess with a guide/target ratio of 1:1. The positions of the cleavage products are indicated on the right and the RNA marker is displayed on the left. (D) Total yeast RNA and recombinant Rnt1p or yeast cell extract prepared from strain YHM111-U2L2 were used to analyze Rnt1p-directed cleavage using EU2dT. Primer complementary to the 3′-flanking sequence of the U2 snRNA branch site was extended on the extracted RNA to map the cleavage site. The reference DNA sequence produced using the same primer is shown on the left. The product corresponding to the cleaved RNA and the U2 5′-end are indicated on the right. Bacterial tRNA was used as negative control for the primer extension. (E) Cleavage comparison between Rnt1p and RNase H in total RNA or cell extract prepared from yeast YHM111-U2L2. The cleavage specificity was determined by primer extension. The reference DNA sequence produced using the same primer is shown on the left. The RNA guide and the DNA oligo used with RNase H targeted the same nucleotides. The positions of Rnt1p and RNase H cleavage products and the U2 5′-end are indicated on the right.
Figure 6
Figure 6. Small RNA guides induce Rnt1p cleavage in vivo.
(A) Mapping the RNA-directed cleavage of U2 from living yeast cells. Yeast cells were electroporated with 2 nmols of EU2dT or mutant RNA guides and total RNA was extracted between 10 minutes and 2 hours after electroporation. The primer PE-U2-Br was annealed with the RNA samples and extended on U2 snRNA. The corresponding DNA sequence is shown on the left. (B) Relative levels of cleaved U2 snRNA after electroporation were established using RNA extracted in A and loaded on 1.2% agarose-formaldehyde gel, transferred to a nylon membrane and hybridized with probes specific for nucleotides 7 to 29 into mature U2 or against the 25S rRNA to serve as internal control and visualized by Phosphor Imager. The intensity of each band was quantified using Image Quant 5.0. The levels of U2 snRNA were normalized against the 25S rRNA and the electroporation efficiency (53±8%), and were plotted as a function of time after electroporation with EU2dT.

Similar articles

Cited by

References

    1. Tijsterman M, Plasterk RH. Dicers at RISC; the mechanism of RNAi. Cell. 2004;117:1–3. - PubMed
    1. Xia H, Mao Q, Paulson HL, Davidson BL. siRNA-mediated gene silencing in vitro and in vivo. Nat Biotechnol. 2002;20:1006–1010. - PubMed
    1. Lamontagne B, Larose S, Boulanger J, Elela SA. The RNase III family: a conserved structure and expanding functions in eukaryotic dsRNA metabolism. Curr Issues Mol Biol. 2001;3:71–78. - PubMed
    1. Wilson HR, Yu D, Peters HK, 3rd, Zhou JG, Court DL. The global regulator RNase III modulates translation repression by the transcription elongation factor N. Embo J. 2002;21:4154–4161. - PMC - PubMed
    1. Ge D, Lamontagne B, Elela SA. RNase III-Mediated Silencing of a Glucose-Dependent Repressor in Yeast. Curr Biol. 2005;15:140–145. - PubMed

Publication types