. 2007 May 30;2(5):e475.
doi: 10.1371/journal.pone.0000475.

Insulin-like growth factor 1 (IGF-1) mediates the effects of enriched environment (EE) on visual cortical development

Affiliations

Insulin-like growth factor 1 (IGF-1) mediates the effects of enriched environment (EE) on visual cortical development

Francesca Ciucci et al. PLoS One. .

Abstract

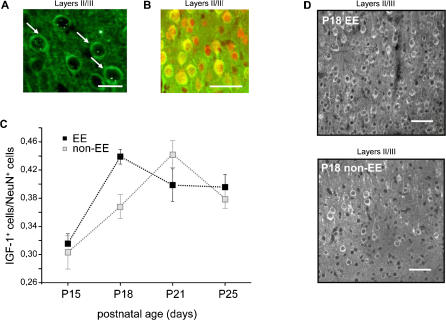
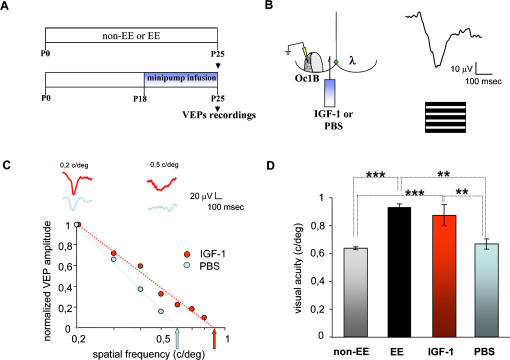
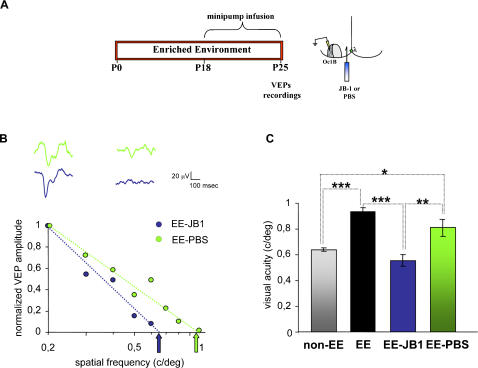
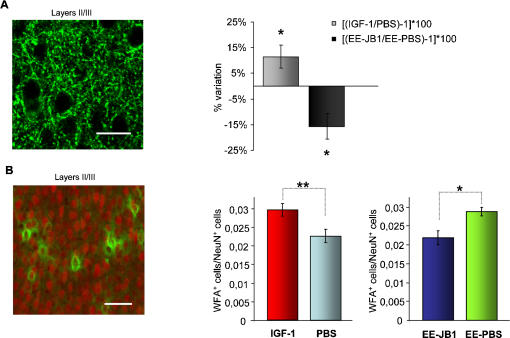
Enriched environment (EE) has been recently shown to affect visual cortex development and plasticity, and to prevent dark rearing effects. The factors mediating EE effects on visual cortical development and plasticity are still unclear. We have investigated whether IGF-1 is involved in mediating EE effects on the developing visual cortex. We show that EE increases the number of IGF-1 positive neurons in the visual cortex at P18. Increasing IGF-1 in the visual cortex of non-EE rats by means of osmotic minipumps implanted at P18 mimics EE effects, accelerating visual acuity development, assessed with Visual Evoked Potentials (VEPs). Blocking IGF-1 action in the visual cortex of EE rats by means of the IGF-1 receptor antagonist JB1 from P18 completely blocks EE action on visual acuity development. These results show that IGF-1 is a key factor mediating EE effects on visual cortical development. We then show that IGF-1 affects GAD65 immunoreactivity in perisomatic innervation and the condensation of Chondroitin Sulphate Proteoglycans (CSPGs) in perineuronal nets (PNNs) in the visual cortex. This suggests that IGF-1 action in mediating EE effects could be exerted through the modulation of intracortical inhibitory circuitry and PNN development.


Conflict of interest statement

Competing Interests: The authors have declared that no competing interests exist.

Figures

Figure 1
Figure 1. Immunoreactivity for IGF-1 in the developing visual cortex: effects of EE.
(A) Typical appearance of IGF-1 positive cells in the developing rat binocular visual cortex Oc1B. Age of the animal, P25, calibration bar 25 µm. (B) Example showing the preponderance of the neuronal phenotype in IGF-1 positive cells in the developing rat binocular visual cortex Oc1B. Age of the animal P18. Staining for IGF-1 green, staining for NeuN (neuronal marker) red, merged image. Calibration bar: 50 µm. (C) Mean number of IGF-1 positive cells in the visual cortex, normalized to the number of neurons (Neu N positive cells) for each developmental age analysed. Black dots are data from EE rats and light grey dots data from non-EE rats. Vertical bars represent SEM. The number of animals analyzed is: for non-EE rats, N = 5 at P15, N = 8 at P18, N = 6 at P21, N = 6 at P25; for EE rats, N = 6 at P15, N = 10 at P18, N = 6 at P21, N = 7 at P25. The normalized number of IGF-1 positive cells increases between P15 and P21 in non-EE rats (Two Way ANOVA, housing (two levels)×age (four levels), factor age significant, p<0,001; post-hoc Tukey's test, p<0,05). In EE rats the normalized number of IGF-1 positive cells increases significantly between P15 and P18; the normalized number at P18 in EE rats is significantly increased with respect to non-EE rats (Two Way ANOVA, housing (two levels)×age (four levels), factor age significant, p<0,001, interaction housing×age significant, p = 0,011; post-hoc Tukey's test, p<0,05). (D) Example of IGF-1 labelling from fields taken in the layers II/III of the rat visual cortex of one P18 EE and one P18 non-EE rat. It is evident the increase in IGF-1 positive cells caused by EE. Calibration bar: 50 µm.
Figure 2
Figure 2. IGF-1 administration in the visual cortex accelerates visual acuity development.
(A) Experimental protocol. (B) Left, schematic representation of minipump implant and recording site for Visual Evoked Potentials (VEPs). Right, representative waveform of VEP recorded from Oc1B in response to visual stimulation with gratings sinusoidally modulated in contrast at 1Hz. (C) Example of visual acuity estimate in one IGF-1 (red) and one vehicle (light blue) treated animal. Experimental points are VEP amplitudes normalized to the mean amplitude of VEP at 0,2 c/deg; thick lines are linear fits to the data. Estimated visual acuities (arrows) are taken as the extrapolation to 0 level of the fitting line. Waveforms above the graph are the VEP recordings obtained at 0,2 and 0,5 c/deg for the IGF-1 (red) and the vehicle (PBS) treated animal (light blue). It is evident that at the higher spatial frequency response is obtained only in the IGF-1 treated rat. (D) Summary of visual acuity in all groups. Data are mean visual acuity and vertical bars represent SEM. Visual acuity of non-EE IGF-1 treated animals (IGF-1, 0,9±0,08 c/deg, N = 5) is significantly higher than in non-EE vehicle treated animals (PBS, 0,67±0,03 c/deg, N = 6) or in non-EE untreated animals (non-EE 0,63±0,01 c/deg, N = 7); the latter two do not differ (One Way ANOVA, p<0,001; post-hoc Tukey's test, significance level 0,05). The visual acuity in non-EE IGF-1 treated rats do not differ from that in P25 EE rats (EE, 0,93±0,03, N = 4) (One Way ANOVA, post-hoc Tukey's test p>0,05). Asterisks denote significant difference (two asterisks, p<0,01, three asterisks p<0,001).
Figure 3
Figure 3. IGF-1 blockade prevents the acceleration of visual acuity development in enriched animals.
(A) Experimental protocol and schematic representation of minipump implant and recording site for VEPs. (B) Example of visual acuity estimated in one JB1 treated EE rat (EE-JB1, blue) and one vehicle treated EE animal (EE-PBS, green). Experimental points are normalized VEP amplitudes; thick lines are linear fits to the data. Estimated visual acuities are indicated by arrows. Waveforms above the graph are VEPs recorded in response to visual stimulation with gratings of spatial frequencies 0,2 and 0,5 c/deg for the JB1 treated (blue) and the vehicle treated EE animal (green). It is evident that at the higher spatial frequency a response is obtained only in the vehicle treated EE rat. (C) Summary of mean visual acuity in all JB1 (0,55±0,05 c/deg, N = 5) and PBS treated (0,81±0,07 c/deg, N = 4) P25 EE animals; data for P25 EE and non-EE rats are replotted from Fig. 2 for comparison. Vertical bars represent SEM. Visual acuity of JB1 treated EE animals is significantly lower than in EE animals either treated with vehicle or untreated and does not differ from the visual acuity of P25 non-EE rats (One Way ANOVA, p<0,001; post-hoc Tukey's test, significance level 0,05). Asterisks denote significant difference (one asterisk, p<0,05; two asterisks, p<0,01; three asterisks, p<0,001).
Figure 4
Figure 4. IGF-1 affects intracortical inhibition and perineuronal nets (PNNs) in the developing visual cortex.
(A) Left, representative example of GAD65 immunoreactivity in the rat visual cortex at P25. It is evident the punctate nature of the staining around cell bodies (puncta-ring). To quantify GAD65 immunoreactivity in puncta rings, immunofluorescence in puncta ring was normalized to background signal. Calibration bar 20 µm. Right: light bar: percentage variation of GAD65 puncta ring immunoreactivity between the cortex implanted at P18 with a IGF-1 filled minipump and the cortex implanted with a PBS filled minipump in P25 non-EE animals (N = 7). Percentage variation computed as [(GAD65 immunoreactivity in IGF-1 treated/GAD65 immunoreactivity in PBS treated cortex) –1]×100. GAD65 immunoreactivity is significantly higher in the IGF-1 treated than in the PBS treated cortex (paired t-test, p<0,05, one asterisk). Right, dark bar: Percentage variation of GAD65 puncta ring immunoreactivity between the cortex implanted at P18 with a JB1 filled minipump and the cortex implanted with a PBS filled minipump in P25 EE animals (N = 5). Percentage variation computed as [(GAD65 immunoreactivity in JB1 treated/GAD65 immunoreactivity in PBS treated cortex) –1]×100. GAD65 immunoreactivity is significantly lower in the JB1 treated than in the PBS treated cortex (paired t-test, p<0,05, one asterisk). Vertical bars indicate SEM. (B) Left, representative example of WFA staining (green) and NeuN staining (red) merged image in the rat visual cortex at P25. WFA stained PNN completely surround cortical neurons. Calibration bar 50: µm. Right, leftmost: PNN surrounded cells (WFA positive cells/NeuN positive cells) are more numerous in the visual cortex treated from P18 to P25 with IGF-1 than in the contralateral, PBS treated cortex of non-EE animals (N = 5 animals, paired t-test, p<0,01, two asterisks). Right, rightmost: PNN surrounded cells (WFA positive cells/NeuN positive cells) are less numerous in the visual cortex treated from P18 to P25 with JB1 than in the contralateral, PBS treated cortex of EE animals (N = 6 animals, paired t-test, p<0,05, one asterisks). Vertical bars represent SEM.

Similar articles

Cited by

References

    1. Rosenzweig MR. Environmental complexity, cerebral change, and behavior. Am Psychol. 1966;21:321–332. - PubMed
    1. Rosenzweig MR, Bennett EL. Psychobiology of plasticity: effects of training and experience on brain and behavior. Behav Brain Res. 1996;78:57–65. - PubMed
    1. van Praag H, Christie BR, Sejnowski TJ, Gage FH. Running enhances neurogenesis, learning, and long-term potentiation in mice. Proc Natl Acad Sci U S A. 1999;96:13427–13431. - PMC - PubMed
    1. Rampon C, Tang YP, Goodhouse J, Shimizu E, Kyin M, et al. Enrichment induces structural changes and recovery from nonspatial memory deficits in CA1 NMDAR1-knockout mice. Nat Neurosci. 2000;3:238–244. - PubMed
    1. van Praag H, Kempermann G, Gage FH. Neural consequences of environmental enrichment. Nat Rev Neurosci. 2000;1:191–198. - PubMed

Publication types

Substances