Regular patterns in cerebellar Purkinje cell simple spike trains
- PMID: 17534435
- PMCID: PMC1868782
- DOI: 10.1371/journal.pone.0000485
Regular patterns in cerebellar Purkinje cell simple spike trains
Abstract
Background: Cerebellar Purkinje cells (PC) in vivo are commonly reported to generate irregular spike trains, documented by high coefficients of variation of interspike-intervals (ISI). In strong contrast, they fire very regularly in the in vitro slice preparation. We studied the nature of this difference in firing properties by focusing on short-term variability and its dependence on behavioral state.
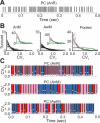
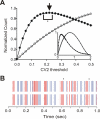
Methodology/principal findings: Using an analysis based on CV(2) values, we could isolate precise regular spiking patterns, lasting up to hundreds of milliseconds, in PC simple spike trains recorded in both anesthetized and awake rodents. Regular spike patterns, defined by low variability of successive ISIs, comprised over half of the spikes, showed a wide range of mean ISIs, and were affected by behavioral state and tactile stimulation. Interestingly, regular patterns often coincided in nearby Purkinje cells without precise synchronization of individual spikes. Regular patterns exclusively appeared during the up state of the PC membrane potential, while single ISIs occurred both during up and down states. Possible functional consequences of regular spike patterns were investigated by modeling the synaptic conductance in neurons of the deep cerebellar nuclei (DCN). Simulations showed that these regular patterns caused epochs of relatively constant synaptic conductance in DCN neurons.
Conclusions/significance: Our findings indicate that the apparent irregularity in cerebellar PC simple spike trains in vivo is most likely caused by mixing of different regular spike patterns, separated by single long intervals, over time. We propose that PCs may signal information, at least in part, in regular spike patterns to downstream DCN neurons.
Conflict of interest statement
Figures


Similar articles
-
Stochastic description of complex and simple spike firing in cerebellar Purkinje cells.Eur J Neurosci. 2007 Feb;25(3):785-94. doi: 10.1111/j.1460-9568.2007.05308.x. Eur J Neurosci. 2007. PMID: 17328774
-
Including long-range dependence in integrate-and-fire models of the high interspike-interval variability of cortical neurons.Neural Comput. 2004 Oct;16(10):2125-95. doi: 10.1162/0899766041732413. Neural Comput. 2004. PMID: 15333210
-
Dynamic synchronization of Purkinje cell simple spikes.J Neurophysiol. 2006 Dec;96(6):3485-91. doi: 10.1152/jn.00570.2006. Epub 2006 Sep 20. J Neurophysiol. 2006. PMID: 16987931
-
Patterns and pauses in Purkinje cell simple spike trains: experiments, modeling and theory.Neuroscience. 2009 Sep 1;162(3):816-26. doi: 10.1016/j.neuroscience.2009.02.040. Epub 2009 Feb 26. Neuroscience. 2009. PMID: 19249335 Review.
-
Spike timing and synaptic dynamics at the awake thalamocortical synapse.Prog Brain Res. 2005;149:91-105. doi: 10.1016/S0079-6123(05)49008-1. Prog Brain Res. 2005. PMID: 16226579 Review.
Cited by
-
A biochemical mechanism for time-encoding memory formation within individual synapses of Purkinje cells.PLoS One. 2021 May 7;16(5):e0251172. doi: 10.1371/journal.pone.0251172. eCollection 2021. PLoS One. 2021. PMID: 33961660 Free PMC article.
-
4-aminopyridine reverses ataxia and cerebellar firing deficiency in a mouse model of spinocerebellar ataxia type 6.Sci Rep. 2016 Jul 6;6:29489. doi: 10.1038/srep29489. Sci Rep. 2016. PMID: 27381005 Free PMC article.
-
Efficient generation of reciprocal signals by inhibition.J Neurophysiol. 2012 May;107(9):2453-62. doi: 10.1152/jn.00083.2012. Epub 2012 Feb 1. J Neurophysiol. 2012. PMID: 22298833 Free PMC article.
-
The cerebellar nuclei take center stage.Cerebellum. 2011 Dec;10(4):633-6. doi: 10.1007/s12311-010-0245-y. Cerebellum. 2011. PMID: 21279491 Free PMC article. No abstract available.
-
Cerebellar control of targeted tongue movements.J Physiol. 2025 Mar;603(5):1141-1169. doi: 10.1113/JP287732. Epub 2025 Jan 26. J Physiol. 2025. PMID: 40019494 Free PMC article.
References
-
- Ivry RB, Spencer RM. The neural representation of time. Curr Opin Neurobiol. 2004;14:225–232. - PubMed
-
- Koekkoek SK, Hulscher HC, Dortland BR, Hensbroek RA, Elgersma Y, et al. Cerebellar LTD and learning-dependent timing of conditioned eyelid responses. Science. 2003;301:1736–1739. - PubMed
-
- Shidara M, Kawano K, Gomi H, Kawato M. Inverse-dynamics model eye movement control by Purkinje cells in the cerebellum. Nature. 1993;365:50–52. - PubMed
-
- Kitazawa S, Kimura T, Yin PB. Cerebellar complex spikes encode both destinations and errors in arm movements. Nature. 1998;392:494–497. - PubMed
Publication types
MeSH terms
LinkOut - more resources
Full Text Sources
Miscellaneous

