. 2007 May 30;2(5):e489.
doi: 10.1371/journal.pone.0000489.

Global surveillance of emerging Influenza virus genotypes by mass spectrometry

Affiliations

Global surveillance of emerging Influenza virus genotypes by mass spectrometry

Rangarajan Sampath et al. PLoS One. .

Abstract

Background: Effective influenza surveillance requires new methods capable of rapid and inexpensive genomic analysis of evolving viral species for pandemic preparedness, to understand the evolution of circulating viral species, and for vaccine strain selection. We have developed one such approach based on previously described broad-range reverse transcription PCR/electrospray ionization mass spectrometry (RT-PCR/ESI-MS) technology.

Methods and principal findings: Analysis of base compositions of RT-PCR amplicons from influenza core gene segments (PB1, PB2, PA, M, NS, NP) are used to provide sub-species identification and infer influenza virus H and N subtypes. Using this approach, we detected and correctly identified 92 mammalian and avian influenza isolates, representing 30 different H and N types, including 29 avian H5N1 isolates. Further, direct analysis of 656 human clinical respiratory specimens collected over a seven-year period (1999-2006) showed correct identification of the viral species and subtypes with >97% sensitivity and specificity. Base composition derived clusters inferred from this analysis showed 100% concordance to previously established clades. Ongoing surveillance of samples from the recent influenza virus seasons (2005-2006) showed evidence for emergence and establishment of new genotypes of circulating H3N2 strains worldwide. Mixed viral quasispecies were found in approximately 1% of these recent samples providing a view into viral evolution.

Conclusion/significance: Thus, rapid RT-PCR/ESI-MS analysis can be used to simultaneously identify all species of influenza viruses with clade-level resolution, identify mixed viral populations and monitor global spread and emergence of novel viral genotypes. This high-throughput method promises to become an integral component of influenza surveillance.


Conflict of interest statement

Competing Interests: The authors from Ibis and SAIC are full-time employees at “for-profit” corporations. None of the other authors have a financial conflict of interest.

Figures

Figure 1
Figure 1. Detection and characterization of important human and avian influenza virus subtypes.
Base composition signatures are shown in A, G, C, T order. Identical base compositions within a column are the same color. Base compositions represented only once are shown in white. Base compositions from human H1N1, human H3N2 and avian/human H5N1 isolates (in green, blue and red boxes, respectively) are included in Figure 2.
Figure 2
Figure 2. Spatial clustering of influenza virus subtypes.
Each axis represents base composition bins (A, G, C, T) from a single primer pair. Solid symbols represent experimental measurements from this study, while open symbols are calculated base compositions determined from published sequences. Human isolates are shown as cubes and avian isolates as spheres. H1N1 isolates are shown in green, H3N2 in blue, and H5N1 in red. Arrows indicate avian influenza viruses isolated from humans.
Figure 3
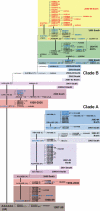
Figure 3. Clade distribution of H3N2 influenza viruses.
Unique base composition types are reported using a six-letter code (see text) and are chronologically sorted bottom to top (color boxes, seasons 1997 to 2006). From year 2000 onwards, seasons were labeled “North” and “South” to reflect the northern or southern hemispheric origin of the samples. Thick vertical bars represent the persistence of main types between consecutive seasons. Within each season, the number of isolates is reported between parentheses for types encountered more than once. Thin horizontal lines represent the spawning of new types through the accumulation of single mutations (left to right). Black font: types determined through sequence analysis; blue font: experimentally determined base composition types; red font: experimentally determined base composition types for season 2005–06. Ten rare sequence types (∼1.5%) were not uniquely discernable by the base composition analysis of the eight amplicons used in this analysis, as more than one subtype produced the same BC-type. These BC-types are indicated by asterisks.
Figure 4
Figure 4. Relationship of founder isolate AADFAA and closest descendents in the 2005–2006 season.
The areas of the circles are scaled to the number of human samples that contained the BC-types. Each concentric ring represents a single, double and triple mutations removed from the founder isolate, color coded for the gene containing the mutation. The order of the letters in the BC-type correspond to the six primer pairs used in this study, targeting PB1, NP, PA, M1, NS1 and NS2, respectively.
Figure 5
Figure 5. Detection of mixed viral populations.
Panels A, B, and C are representations of mass spectral data. The heat maps in the top sections are a charge state representation of the data; the spectral plots in the lower sections were created by filtering the charge state responses to create signal representations vs. mass. The main peaks on the spectral plots are the primary amplicons and appear as hot spots in the charge state representations; the secondary amplicons appear as “cloudy” regions to the right and left for the forward and reverse strands, respectively. Panels A and B contain two species in relatively large ratios (20–50% mixtures) and involve the season 2005–2006 parent BC-type (AADFAA) and a type with a single mutation (panel A, within the M1 amplicon, BC-type AAHFAA; panel B, within the overlapping NS1 and NS2 amplicons, BC-type AADFBB). Panel C shows detection of a low abundance type (2–5%). Panel D shows a close-up view of the mass spectrum from Panel C. In this view, the shoulder of the peak is fit with a single mass model (blue dotted line) and a two mass model (dashed red line).

Similar articles

Cited by

References

    1. Simonsen L, Fukuda K, Schonberger LB, Cox NJ. The impact of influenza epidemics on hospitalizations. J Infect Dis. 2000;181:831–837. - PubMed
    1. Thompson WW, Shay DK, Weintraub E, Brammer L, Bridges CB, et al. Influenza-associated hospitalizations in the United States. JAMA. 2004;292:1333–1340. - PubMed
    1. Kilbourne ED. Influenza pandemics of the 20th century. Emerg Infect Dis. 2006;12:9–14. - PMC - PubMed
    1. Kilbourne ED. Influenza pandemics: can we prepare for the unpredictable? Viral Immunol. 2004;17:350–357. - PubMed
    1. Xu X, Smith CB, Mungall BA, Lindstrom SE, Hall HE, et al. Intercontinental circulation of human influenza A(H1N2) reassortant viruses during the 2001–2002 influenza season. J Infect Dis. 2002;186:1490–1493. - PubMed

Publication types

MeSH terms