. 2007 May;9(5):382-91.
doi: 10.1593/neo.07145.

Correlation of MRI biomarkers with tumor necrosis in Hras5 tumor xenograft in athymic rats

Affiliations

Correlation of MRI biomarkers with tumor necrosis in Hras5 tumor xenograft in athymic rats

Daniel P Bradley et al. Neoplasia. 2007 May.

Abstract

Magnetic resonance imaging (MRI) can measure the effects of therapies targeting the tumor vasculature and has demonstrated that vascular-damaging agents (VDA) induce acute vascular shutdown in tumors in human and animal models. However, at subtherapeutic doses, blood flow may recover before the induction of significant levels of necrosis. We present the relationship between changes in MRI biomarkers and tumor necrosis. Multiple MRI measurements were taken at 4.7 T in athymic rats (n = 24) bearing 1.94 +/- 0.2-cm3 subcutaneous Hras5 tumors (ATCC 41000) before and 24 hours after clinically relevant doses of the VDA, ZD6126 (0-10 mg/kg, i.v.). We measured effective transverse relaxation rate (R2*), initial area under the gadolinium concentration-time curve (IAUGC(60/150)), equivalent enhancing fractions (EHF(60/150)), time constant (K(trans)), proportion of hypoperfused voxels as estimated from fit failures in K(trans) analysis, and signal intensity (SI) in T2-weighted MRI (T(2)W). ZD6126 treatment induced > 90% dose-dependent tumor necrosis at 10 mg/kg; correspondingly, SI changes were evident from T2W MRI. Although R2* did not correlate, other MRI biomarkers significantly correlated with necrosis at doses of > or = 5 mg/kg ZD6126. These data on Hras5 tumors suggest that the quantification of hypoperfused voxels might provide a useful biomarker of tumor necrosis.


Figures

Figure 1
Figure 1
T2W images of Hras5 tumors before and after ZD6126 treatment. T2W tumor images 24 hours before (a–d) or 24 hours after (e–h) treatment with vehicle (a and e) or ZD6126 at 5.0 mg/kg (b and f), 7.5 mg/kg (c and g), or 10.0 mg/kg (d and h). Visual inspection revealed a broadly homogenous signal across the tumor mass in pretreated and vehicle-treated animals. After ZD6126 treatment, heterogeneity in SI within tumors was seen (f–h). One hour after the second MRI, tumors were excised. Representative H&E- stained tumor sections are shown for animals' treatment with vehicle (i) or ZD6126 at a dose of 5.0 mg/kg (j), 7.5 mg/kg (k and m), or 10.0 mg/kg (l and n), respectively. Necrotic (N) and viable (V) regions of the tumor are identified. Vehicle-treated animals showed a low level of spontaneous tumor necrosis (i), whereas higher doses of ZD6126 resulted in extensive central tumor necrosis with smaller regions of viable tissue toward the periphery (k and l). After 10 mg/kg ZD6126, there is a clear boundary between the necrotic core and the viable tumor rim (n), whereas at lower doses, there was evidence of heterogeneity across the tumor (m).
Figure 2
Figure 2
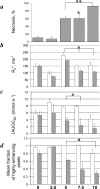
Analysis of necrosis and MRI biomarkers in Hras5 tumors following ZD6126 treatment. (a) Necrosis (mean ± SEM; %) was assessed in H&E-stained sections. ZD6126 at doses of ≥ 5.0 mg/kg produced significant increases in tumor necrosis 24 hours after treatment. Whole-tumor R2* (mean ± SEM; msec-1), IAUGC60 (mean ± SEM; mmol/sec), and EHF (mean ± SEM) are shown in (b)–(d), respectively. Pretreatment (open bars) and posttreatment (hatched bars) values are shown for each dose group. *P < .05, **P < .01; one-tailed unpaired t-test compared with vehicle.
Figure 3
Figure 3
Ktrans in Hras5 tumors following ZD6126 treatment. (a) Single-slice Ktrans maps are illustrated 24 hours before and 24 hours after ZD6126 administration. Ktrans maps illustrate characteristic VDA effects. In both pretreatment and vehicle-treated tumors, there are some regions of low Ktrans, possibly corresponding with spontaneous necrosis. In contrast, 24 hours after treatment with ZD6126, the number of fitted Ktrans values in the tumors became progressively lower until < 50% of tumor voxel values fitted the model. Whole-tumor Ktrans measurements (mean ± SEM; sec-1) before (open columns) or after (hatched columns) treatment arshown either including (b) or excluding (c) zero fit-failure values. *P < .05, one-tailed unpaired t-test compared with vehicle.
Figure 4
Figure 4
Ktrans fit failures in the Hras-5 tumor following ZD6126 treatment. The proportion (mean ± SEM; %) of voxels that failed to fit the Tofts and Kermode model was calculated before (open columns) and after (hatched columns) ZD6126 treatment. Mean tumor necrosis is also plotted for reference (π). In pretreated tumors, the proportion of voxels failing to fit to the model was low, which suggests that the Hras5 tumor is well perfused with contrast agent. However, following ZD6126 treatment at doses of ≥ 5 mg/kg, the proportion of fit failures increases markedly, indicating inaccessibility for the contrast agent.
Figure 5
Figure 5
A strong and significant correlation between fit failures and tumor necrosis in the Hras5 tumor model. The proportion of fit failures (%) and tumor necrosis 24 hours after vehicle or ZD6126 treatment was calculated on an animal-by-animal basis (n = 24).

Similar articles

Cited by

References

    1. Folkman J. Tumor angiogenesis. Adv Cancer Res. 1985;43:175–203. - PubMed
    1. Folkman J. Angiogenesis in cancer, vascular, rheumatoid and other disease. Nat Med. 1995;1:27–31. - PubMed
    1. Fox SB, Gasparini G, Harris AL. Angiogenesis: pathological, prognostic, and growth-factor pathways and their link to trial design and anticancer drugs. Lancet Oncol. 2001;2:278–289. - PubMed
    1. Thorpe PE. Vascular targeting agents as cancer therapeutics. Clin Cancer Res. 2004;10:415–427. - PubMed
    1. Davis PD, Dougherty GJ, Blakey DC, Galbraith SM, Tozer GM, Holder AL, Naylor MA, Nolan J, Stratford MR, Chaplin DJ, et al. ZD6126: a novel vascular-targeting agent that causes selective destruction of tumor vasculature. Cancer Res. 2002;62:7247–7253. - PubMed

LinkOut - more resources