Bacteriorhodopsin photocycle at cryogenic temperatures reveals distributed barriers of conformational substates
- PMID: 17535910
- PMCID: PMC1887559
- DOI: 10.1073/pnas.0703859104
Bacteriorhodopsin photocycle at cryogenic temperatures reveals distributed barriers of conformational substates
Abstract
The time course of thermal reactions after illumination of 100% humidified bacteriorhodopsin films was followed with FTIR spectroscopy between 125 and 195 K. We monitored the conversion of the initial photoproduct, K, to the next, L intermediate, and a shunt reaction of the L state directly back to the initial BR state. Both reactions can be described by either multiexponential kinetics, which would lead to apparent end-state mixtures that contain increasing amounts of the product, i.e., L or BR, with increasing temperature, or distributed kinetics. Conventional kinetic schemes that could account for the partial conversion require reversible reactions, branching, or parallel cycles. These possibilities were tested by producing K or L and monitoring their interconversion at a single temperature and by shifting the temperature upward or downward after an initial incubation and after their redistribution. The results are inconsistent with any conventional scheme. Instead, we attribute the partial conversions to the other alternative, distributed kinetics, observed previously in myoglobin, which arise from an ensemble of frozen conformational substates at the cryogenic temperatures. In this case, the time course of the reactions reflects the progressive depletion of distinct microscopic substates in the order of their increasing activation barriers, with a distribution width for K to L reaction of approximately 7 kJ/mol.
Conflict of interest statement
The authors declare no conflict of interest.
Figures


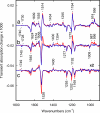
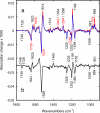
 O stretch band), illustrating the decay of L to BR (Fig. 1c) at various temperatures, after a photostationary state containing virtually only L was created at the same temperature with red light. The data and the fitted curves are as in Fig. 3 a and b. (b) For clarity, only every third data point is displayed.


Similar articles
-
Low-temperature FTIR study of multiple K intermediates in the photocycles of bacteriorhodopsin and xanthorhodopsin.J Phys Chem B. 2010 Mar 4;114(8):2920-31. doi: 10.1021/jp908698f. J Phys Chem B. 2010. PMID: 20136108 Free PMC article.
-
The effect of protein conformation change from alpha(II) to alpha(I) on the bacteriorhodopsin photocycle.Biophys J. 2000 Apr;78(4):2031-6. doi: 10.1016/S0006-3495(00)76750-6. Biophys J. 2000. PMID: 10733981 Free PMC article.
-
Structural characterization of the L-to-M transition of the bacteriorhodopsin photocycle.Biophys J. 1998 Sep;75(3):1446-54. doi: 10.1016/S0006-3495(98)74063-9. Biophys J. 1998. PMID: 9726946 Free PMC article.
-
Connectivity of the retinal Schiff base to Asp85 and Asp96 during the bacteriorhodopsin photocycle: the local-access model.Biophys J. 1998 Sep;75(3):1455-65. doi: 10.1016/S0006-3495(98)74064-0. Biophys J. 1998. PMID: 9726947 Free PMC article.
-
Electrogenic processes and protein conformational changes accompanying the bacteriorhodopsin photocycle.Biochim Biophys Acta. 2000 Aug 30;1460(1):204-19. doi: 10.1016/s0005-2728(00)00140-7. Biochim Biophys Acta. 2000. PMID: 10984601 Review.
Cited by
-
High resolution approach to the native state ensemble kinetics and thermodynamics.Biophys J. 2008 Dec 15;95(12):5524-32. doi: 10.1529/biophysj.108.136697. Epub 2008 Sep 19. Biophys J. 2008. PMID: 18805918 Free PMC article.
-
Modulation of Light Energy Transfer from Chromophore to Protein in the Channelrhodopsin ReaChR.Biophys J. 2020 Aug 4;119(3):705-716. doi: 10.1016/j.bpj.2020.06.031. Epub 2020 Jul 10. Biophys J. 2020. PMID: 32697975 Free PMC article.
-
Conformational changes in the archaerhodopsin-3 proton pump: detection of conserved strongly hydrogen bonded water networks.J Biol Phys. 2012 Jan;38(1):153-68. doi: 10.1007/s10867-011-9246-4. Epub 2011 Dec 10. J Biol Phys. 2012. PMID: 23277676 Free PMC article.
-
The role of protein-solvent hydrogen bond dynamics in the structural relaxation of a protein in glycerol versus water.Eur Biophys J. 2008 Jun;37(5):701-9. doi: 10.1007/s00249-008-0324-x. Epub 2008 Apr 22. Eur Biophys J. 2008. PMID: 18427802
-
Light-driven Na(+) pump from Gillisia limnaea: a high-affinity Na(+) binding site is formed transiently in the photocycle.Biochemistry. 2014 Dec 9;53(48):7549-61. doi: 10.1021/bi501064n. Epub 2014 Nov 24. Biochemistry. 2014. PMID: 25375769 Free PMC article.
References
-
- Frauenfelder H, Parak F, Young RD. Annu Rev Biophys Biophys Chem. 1988;17:451–479. - PubMed
-
- Iben IE, Braunstein D, Doster W, Frauenfelder H, Hong MK, Johnson JB, Luck S, Ormos P, Schulte A, Steinbach PJ, et al. Phys Rev Lett. 1989;62:1916–1919. - PubMed
-
- Frauenfelder H, Sligar SG, Wolynes PG. Science. 1991;254:1598–1603. - PubMed
Publication types
MeSH terms
Substances
Grants and funding
LinkOut - more resources
Full Text Sources

