. 2007 Jun;129(6):461-75.
doi: 10.1085/jgp.200709733.

Block of CaV1.2 channels by Gd3+ reveals preopening transitions in the selectivity filter

Affiliations

Block of CaV1.2 channels by Gd3+ reveals preopening transitions in the selectivity filter

Olga Babich et al. J Gen Physiol. 2007 Jun.

Abstract

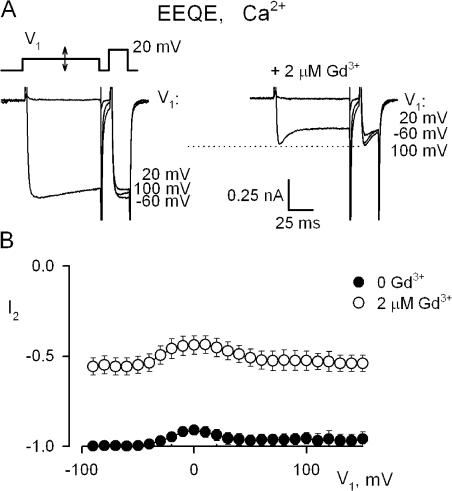
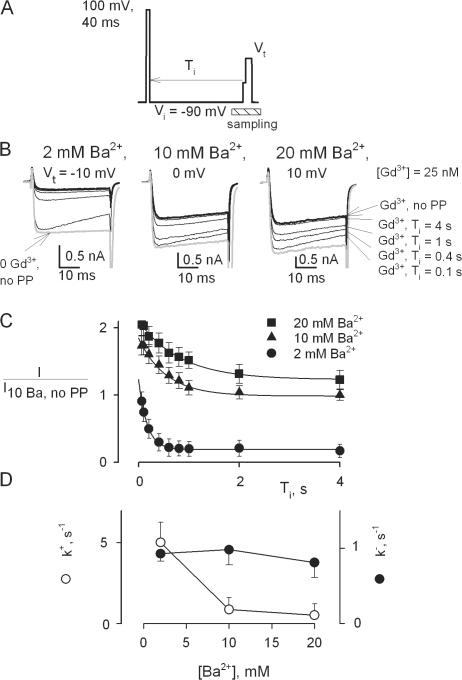
Using the lanthanide gadolinium (Gd(3+)) as a Ca(2+) replacing probe, we investigated the voltage dependence of pore blockage of Ca(V)1.2 channels. Gd(+3) reduces peak currents (tonic block) and accelerates decay of ionic current during depolarization (use-dependent block). Because diffusion of Gd(3+) at concentrations used (<1 microM) is much slower than activation of the channel, the tonic effect is likely to be due to the blockage that occurred in closed channels before depolarization. We found that the dose-response curves for the two blocking effects of Gd(3+) shifted in parallel for Ba(2+), Sr(2+), and Ca(2+) currents through the wild-type channel, and for Ca(2+) currents through the selectivity filter mutation EEQE that lowers the blocking potency of Gd(3+). The correlation indicates that Gd(3+) binding to the same site causes both tonic and use-dependent blocking effects. The apparent on-rate for the tonic block increases with the prepulse voltage in the range -60 to -45 mV, where significant gating current but no ionic current occurs. When plotted together against voltage, the on-rates of tonic block (-100 to -45 mV) and of use-dependent block (-40 to 40 mV) fall on a single sigmoid that parallels the voltage dependence of the gating charge. The on-rate of tonic block by Gd(3+) decreases with concentration of Ba(2+), indicating that the apparent affinity of the site to permeant ions is about 1 mM in closed channels. Therefore, we propose that at submicromolar concentrations, Gd(3+) binds at the entry to the selectivity locus and that the affinity of the site for permeant ions decreases during preopening transitions of the channel.


Figures

Figure 1.
Figure 1.
Tonic and use-dependent effects of Gd3+ in different conditions, in which blocker potency is altered. Gray lines illustrate traces elicited in the presence of blocker scaled to the magnitude of control currents in the absence of blocker. (A) In 10 mM Ca2+, application of 0.2 μM Gd3+ reduced peak currents by about one half during the first pulse (I1, tonic block), but to a much greater extent at the second pulse (I2, use-dependent block). (B) With 10 mM Ba2+, both tonic and use-dependent block occurred at 25 nM Gd3+. (C) Although Ba2+ currents inactivated more rapidly in channels with the β3 subunit rather than with the β2a subunit (compare with B), tonic and use-dependent effects of Gd3+ were similar for both β subunits. (D) Exemplar Ca2+ currents through the EEQE mutant of the selectivity locus recorded with and without 2 μM Gd3+. (E) Dose–response curves for tonic effect of Gd3+ determined for different experimental conditions (indicated). Tonic block is described by relative magnitude of peak current during the first pulse. Before averaging, each peak current measured in the presence of blocker was normalized to its value in the absence of blocker. n = 6–8 cells were analyzed for every experimental condition. Lines are best fits by hyperbolic equation I = 1/(1 + [Gd3+]/IC50), where IC50 is the concentration of half-block. For Ba2+ currents, IC50 = 0.03 ± 0.01 μM. Only one fit is shown for cells with β3 and β2a subunits, because the IC50 was not significantly different in these cells. For Sr2+ currents, IC50 = 0.12 ± 0.02 μM. For Ca2+ currents through the wild-type channel, IC50 = 0.29 ± 0.05 μM. For Ca2+ currents trough the EEQE mutant in the selectivity locus, IC50 = 2.1 ± 0.4 μM. (F) Dose–response curves for use-dependent blocking effects of Gd3+ determined for the same experimental conditions as in panel E. Use-dependent block is described by relative magnitude of peak current during the second pulse. Before averaging, the value of peak current at the second pulse was normalized to the value of peak current at the first pulse. Lines are best fits by hyperbolic equation I = A/(1 + [Gd3+]/IC50), where A is a constant and IC50 is the concentration of half-block. For Ba2+ currents in cells with the β3 subunit, A = 0.57 ± 0.05, IC50 = 0.022 ± 0.004 μM. For Ba2+ currents in cells with the β2a subunit, A = 0.82 ± 0.03, IC50 = 0.021 ± 0.004 μM. For Sr2+ currents, A = 0.64 ± 0.06, IC50 = 0.08 ± 0.02 μM. For Ca2+ currents trough the wild-type channel, A = 0.61 ± 0.05, IC50 = 0.15 ± 0.03 μM. For Ca2+ currents trough the EEQE mutant in the selectivity locus, A = 0.92 ± 0.07, IC50 = 7.1 ± 2.6 μM.
Figure 2.
Figure 2.
Voltage dependence of tonic and use-dependent block of Ba2+ currents as determined by the double-pulse experiments. Both components of Gd3+ block were relived at conditioning to large positive voltages. (A) Without Gd3+, test Ba2+ current was less after conditioning at 0 mV in comparison with the −60-mV conditioning. Application of 25 nM Gd3+ increased the effect of conditioning at 0 mV. However, test currents in the presence of Gd3+ increased after conditioning to 100 mV to the levels that exceeded maximal blocked currents and reached the magnitude of unblocked test current after prepulse to 100 mV. Therefore, both use-dependent and tonic block were relieved by prepulse to 100 mV. (B) Peak current–voltage relationships for the first pulse. Filled symbols plot values in unblocked channels. Open symbols are for currents in the presence of Gd3+. Before averaging (n = 6), in each cell peak currents at the first pulse were normalized to their maximal value in the absence of blocker. (C) Availabilities of current at the second pulse (test) plotted vs. voltage of the first pulse (conditioning). Before averaging, in each cell peak currents at the test pulse were normalized to their value determined with conditioning at −90 mV in the absence of blocker. Gd3+ did not significantly reduce Ba2+ currents measured after prepulses to voltages more positive than 70 mV. (D) Voltage dependence of tonic block determined from the data in B. (E) Voltage dependence of use-dependent block determined from the data in C.
Figure 3.
Figure 3.
At any concentration of Gd3+, Ca2+ currents through the wild-type channel were minimal after conditioning at intermediate voltages. (A) Without Gd3+, test Ca2+ current was less after conditioning at 20 mV in comparison with the −60-mV conditioning. Application of 0.2 μM Gd3+ increased the effect of conditioning at 20 mV. However, the additional reduction of test current due to Gd3+ was partially relieved by conditioning at 100 mV. (B) Availabilities of test Ca2+ current plotted vs. conditioning voltage. Before averaging (n = 8), in each cell peak currents at the test pulse were normalized to their value determined with conditioning at −90 mV in the absence of blocker. In the absence of Gd3+ (circles), test currents were minimal after prepulses to 10 mV due to Ca2+-dependent inactivation. 0.1 μM Gd3+ (squares) enhanced the reduction of currents at intermediate voltages, but it did not significantly reduce Ca2+ currents measured after prepulses to voltages more positive than 90 mV. At greater amounts of Gd3+ (indicated), the voltage-dependent relief of block required stronger prepulses and it was not complete.
Figure 4.
Figure 4.
Gd3+ block of Ca2+ currents through the channels with Ca2+-dependent inactivation diminished by coexpression with the mutant apo-calmodulin CAM1234. (A) Without Gd3+, conditioning to 20 mV had little effect on test Ca2+ current. At 0.2 μM Gd3+, conditioning at 20 mV caused significant reduction of Ca2+ current even though Ca2+-dependent inactivation was small. The reduction of test current due to Gd3+ was partially relieved by conditioning at 100 mV. (B) Availabilities of test Ca2+ current plotted vs. conditioning voltage. Before averaging (n = 5), in each cell peak currents at the test pulse were normalized to their value determined with conditioning at −90 mV in the absence of blocker. In the absence of Gd3+ (circles), the availability of test current was nearly a sigmoid function of voltage. With Gd3+, test currents were minimal after prepulses to intermediate voltages despite Ca2+-dependent inactivation was absent. With 0.1 μM Gd3+ (squares), the magnitude of Ca2+ currents measured after prepulses to voltages more positive than 80 mV was the same as without Gd3+. At greater amounts of Gd3+ (indicated), the voltage-dependent relief required stronger prepulses and it was not complete.
Figure 5.
Figure 5.
Gd3+ block of Ca2+ currents through the EEQE mutant of the selectivity locus. The mutant diminishes Ca2+-dependent inactivation (Zong et al., 1994) and Gd3+ block (Fig. 1). (A) Without Gd3+, conditioning prepulses to different voltages (indicated) had little effect on test Ca2+ current. Addition of 2 μM Gd3+ blocked test currents by about one half regardless of the voltage of conditioning pulse (indicated). (B) Availabilities of test Ca2+ current plotted vs. conditioning voltage. Before averaging (n = 5), in each cell peak currents at the test pulse were normalized to their value determined with conditioning at −90 mV in the absence of blocker. In the absence of Gd3+ (filled circles), the availability of test current was nearly independent on voltage showing dramatic reduction of inactivation in the EEQE mutant. With 2 μM Gd3+ (open circles), the extent of additional block at intermediate voltages was small and there was no relief of block even at 150 mV.
Figure 6.
Figure 6.
Reblock of closed channels. (A) Double-pulse protocol used to study kinetics of block of closed channels during interpulses of various duration (Ti) and voltage (Vi). (B) Prepulses to 100 mV had no measurable effect on test Ba2+ currents in the absence of Gd3+. (C) In presence of Gd3+, the magnitude of test current recorded briefly after the prepulse was similar to that without Gd3+. Test currents decreased with increasing interpulse duration. After long interpulses, test currents became equal to those without prepulse (tonic block).
Figure 7.
Figure 7.
Dependence of block of closed channels on voltage. (A) Test currents were determined by pairs. First, a control current was recorded without prepulse (gray line). After 30 s at the holding potential of −90 mV, the pulse protocol shown by black line was applied. To avoid heavy-duty cycle effect, the next pair of currents was determined after holding the cell at −90 mV for at least 30 s. (B) Pairs of control (gray lines) and test Ba2+ currents (black lines) elicited without Gd3+ as described in A for the interpulse voltage of −60 mV and different interpulse duration (indicated). Test currents after 6 s interpulse were reduced by <10% because of inactivation at −60 mV. (C) Pairs of control and test Ba2+ currents elicited in the presence of 25 nM Gd3+ for the interpulse voltage of −60 mV. Control currents were reduced due to tonic block at the holding potential of −90 mV. Test currents recorded with a 50-ms interpulse were nearly as large as currents in the absence of Gd3+, but they decreased with the duration of the interpulse and became smaller than the control currents for interpulses longer than 2 s. (D) Averaged magnitudes of test currents determined at different interpulse voltage. n = 6–10 for each [Ba2+]. The lines are best fits by the sum of two exponential and a constant: I = ae−bt + ce−dt + e. For −90 mV interpulse, a = 0.84 ± 0.12, b = 1.89 ± 0.07 s−1, c = 0, e = 1. For −60 mV, a = 0.86 ± 0.10, b = 1.91 ± 0.06 s−1, c = 0.35 ± 0.12, d = 0.46 ± 0.08 s−1, e = 0.55 ± 0.08. For −55 mV, a = 0.85 ± 0.09, b = 1.93 ± 0.07 s−1, c = 0.39 ± 0.10, d = 0.43 ± 0.08 s−1, e = 0.28 ± 0.07. For −50 mV, a = 0.95 ± 0.12, b = 2.01 ± 0.07 s−1, c = 0.44 ± 0.10, d = 0.43 ± 0.09 s−1, e = 0.17 ± 0.07. For −45 mV, a = 1.01 ± 0.11, b = 2.29 ± 0.08 s−1, c = 0.51 ± 0.12, d = 0.44 ± 0.08 s−1, e = 0.03 ± 0.03. (E) Estimates of rates of reblock determined from the fast kinetic component of reduction of test currents defined in D. k = b/(1 + E), k+ = bE/(1 + E), where b is the rate of the fast component and E = a/(a + c + e). The lines are drawn by eye.
Figure 8.
Figure 8.
Dependence of block of closed channels on [Ba2+]. (A) Voltage pulse protocol to study kinetics of reblock at −90 mV. (B) Test currents obtained with interpulses of different duration (indicated). Thick lines show test currents obtained without prepulses. Gray lines show test currents without Gd3+ and black lines are traces obtained in the presence of 25 nM Gd3+. (C) Averaged magnitudes of test currents determined for different [Ba2+] (indicated). n = 5–8 for each [Ba2+]. The lines are best fits by the sum of an exponential and a constant: I = ae−bt + c. For 2 mM, a = 1.04 ± 0.07, b = 5.94 ± 0.13 s−1, c = 0.19 ± 0.06. For 10 mM, a = 0.86 ± 0.13, b = 1.83 ± 0.08 s−1, c = 1. For 20 mM, a = 0.88 ± 0.12, b = 1.21 ± 0.07 s−1, c = 1.23 ± 0.13. (D) Estimates of rates of reblock determined from the reduction of test currents defined in A. k = b/(1 + E), k+ = bE/(1 + E), where b is the rate of reduction of current and E = a/(a + c).
Figure 9.
Figure 9.
Acceleration of Gd3+ block occurs at voltage steps that do not cause ionic currents. (A) Voltage pulse protocol. (B) Exemplar Ca2+ currents recorded in the presence of 1 μM Gd3+ with (black lines) and without (gray lines) the prepulse to 200 mV. Control currents (traces a and c) did not depend on the interpulse voltage Vi (indicated), but test currents recorded after the prepulse (traces b and d) decreased with Vi in the range where no ionic currents could be recorded (e.g., at −70 mV). At the same time, the voltage steps from −200 mV to Vi caused significant gating currents (indicated by arrows). (C) Averaged magnitude of test currents vs. voltage of the interpulse. Before averaging, each value was normalized to the magnitude at Vi = −100 mV determined in the same cell (n = 4).
Figure 10.
Figure 10.
Prepulses used to study reblock of open channels changed neither magnitude nor kinetics of test currents in the absence of Gd3+. Exemplar currents recorded with (black lines) and without (gray lines) the prepulse to 200 mV. (A) Double-pulse protocol used to study kinetics of block of open channels during voltage steps (V) that activate ionic currents. (B) Prepulses to 200 mV had no measurable effect on test Ba2+ currents in the absence of Gd3+. The currents were recoded at V = 0 mV. (C) Prepulses to 200 mV had no measurable effect on test Ca2+ currents in the absence of Gd3+. The currents were recoded at V = 20 mV in a different cell.
Figure 11.
Figure 11.
Kinetics of block of Ba2+ currents. (A) Test Ba2+ currents elicited by a pulse protocol similar to that in Fig. 10. Traces are shown for test voltages to −60–40 mV, increment 20 mV. Because of the prepulse to 200 mV, tonic block by Gd3+ was removed and reduction of currents during test voltage steps reflected reblock of open channels. (B) The averaged rates of best fits by the sum of an exponential and a constant to the decay phase of test currents recorded as in A are plotted vs. test voltage for different [Gd3+] (indicated). n = 5. (C) The averaged rates of current decay are plotted vs. [Gd3+] for different test voltages (indicated). The data are the same as in B.
Figure 12.
Figure 12.
Kinetics of block of Ca2+ currents. (A) Test Ca2+ currents elicited similarly to that in Fig. 11. (B) The averaged rates of best fits by the sum of an exponential and a constant to the decay phase of test currents recorded as in A are plotted vs. test voltage for different [Gd3+] (indicated). n = 4. (C) The averaged rates of current decay are plotted vs. [Gd3+] for different test voltages (indicated). The data are the same as in B.
Figure 13.
Figure 13.
The on-rates of Gd3+ block of “closed” channels (filled symbols) and “open” channels (open symbols) fall on a single sigmoid that parallels the voltage dependence of the gating charge movement.
Figure 14.
Figure 14.
Gd3+ block does not change gating currents recorded at voltages before channel opening. Black traces, asymmetric currents (the sum of ionic and gating currents) in the bathing solution with 10 mM Ca2+; gray traces, asymmetric currents in the bathing solution with 10 mM Ca2+ and 1 μM Gd3+.

Comment in

References

    1. Almers, W., and E.W. McCleskey. 1984. Non-selective conductance in calcium channels of frog muscle: calcium selectivity in a single-file pore. J. Physiol. 353:585–608. - PMC - PubMed
    1. Armstrong, C.M., and J. Neyton. 1991. Ion permeation through calcium channels. A one site model. Ann. NY Acad. Sci. 635:18–25. - PubMed
    1. Babich O., D. Isaev, and R. Shirokov. 2005. Role of extracellular Ca2+ in gating of CaV1.2 channels. J. Physiol. 565:709–715. - PMC - PubMed
    1. Babich, O., V. Matveev, A.L. Harris, and R. Shirokov. 2007. Ca2+-dependent inactivation of CaV1.2 channels prevents Gd3+ block: does Ca2+ block the pore of inactivated channels? J. Gen. Physiol. 129:477–483. - PMC - PubMed
    1. Bahinski, A., A. Yatani, G. Mikala, S. Tang, S. Yamamoto, and A. Schwartz. 1997. Charged amino acids near the pore entrance influence ion-conduction of a human L-type cardiac calcium channel. Mol. Cell. Biochem. 166:125–134. - PubMed

Publication types

MeSH terms