. 2007 Jun 4;177(5):817-27.
doi: 10.1083/jcb.200609017. Epub 2007 May 29.

An essential role for the SHIP2-dependent negative feedback loop in neuritogenesis of nerve growth factor-stimulated PC12 cells

Affiliations

An essential role for the SHIP2-dependent negative feedback loop in neuritogenesis of nerve growth factor-stimulated PC12 cells

Kazuhiro Aoki et al. J Cell Biol. .

Abstract

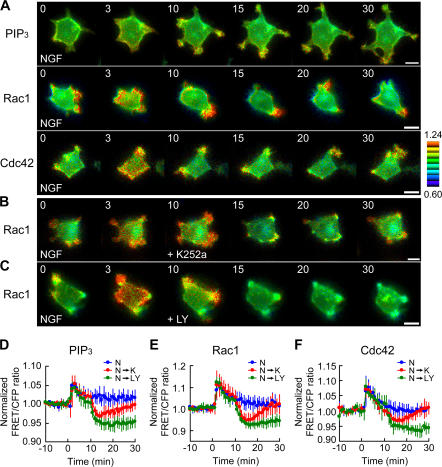
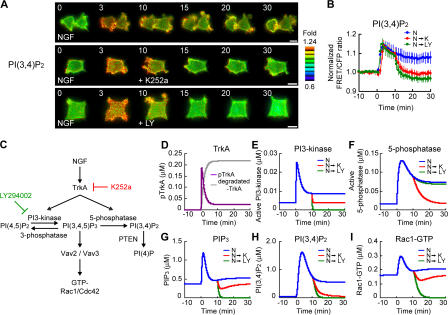
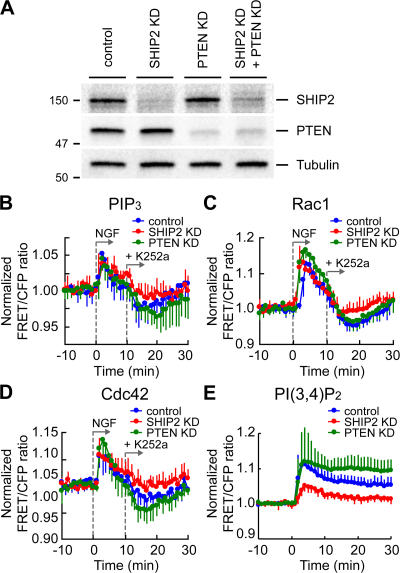
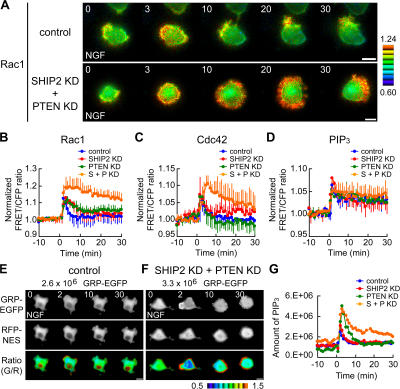
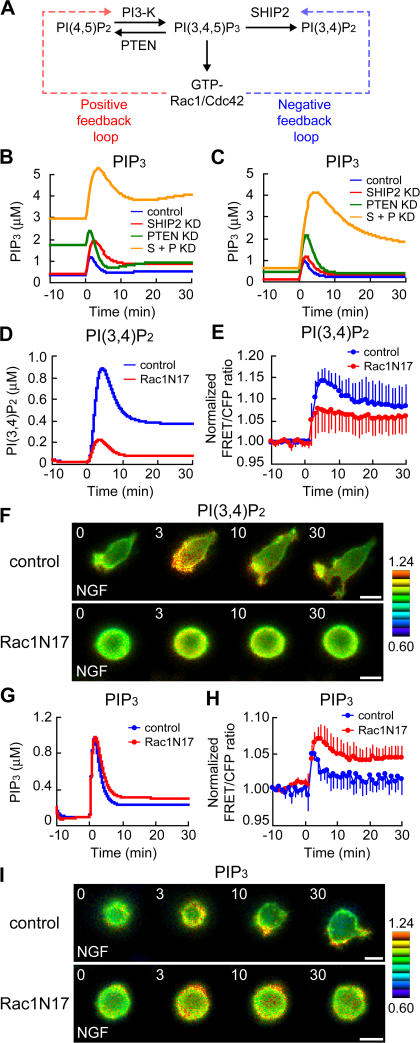
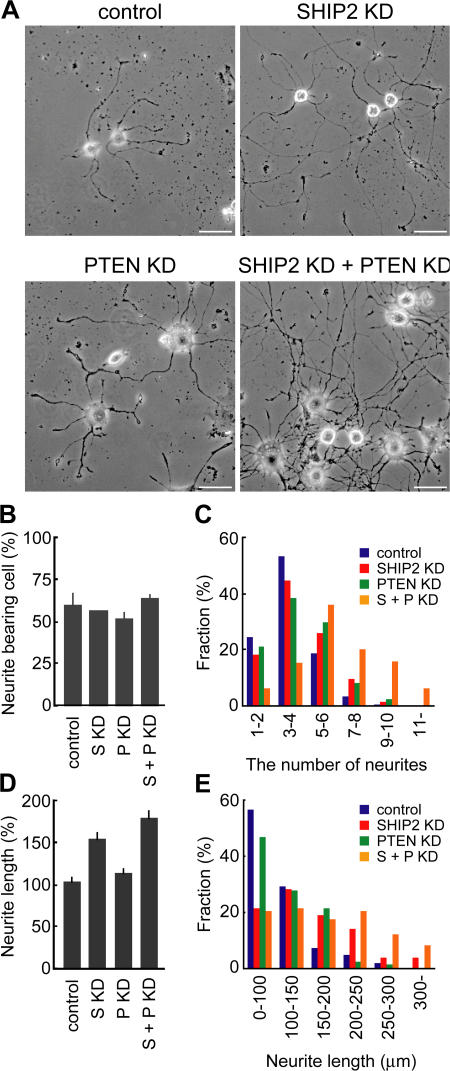
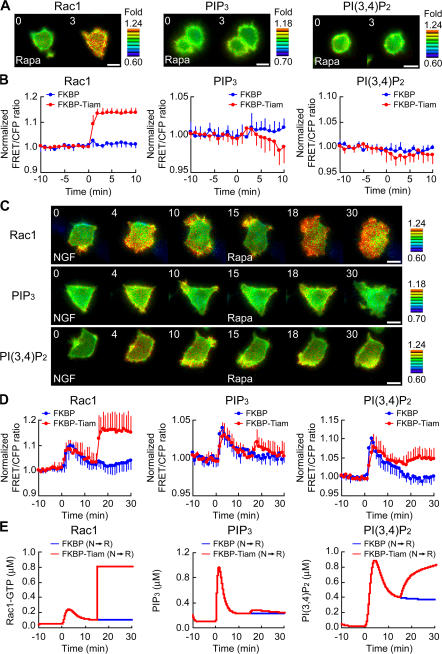
The local accumulation of phosphatidylinositol (3,4,5) trisphosphate (PIP(3)) and resulting activation of Rac1/Cdc42 play a critical role in nerve growth factor (NGF)-induced neurite outgrowth. To further explore the mechanism, we visualized PIP(3), phosphatidylinositol (3,4) bisphosphate, and Rac1/Cdc42 activities by fluorescence resonance energy transfer (FRET) imaging in NGF-stimulated PC12 cells. Based on the obtained FRET images, and with the help of in silico kinetic reaction model, we predicted that PI-5-phosphatase negatively regulates PIP(3) upon NGF stimulation. In agreement with this model, depletion of Src homology 2 domain-containing inositol polyphosphate 5-phosphatase 2 (SHIP2) markedly potentiated NGF-induced Rac1/Cdc42 activation and PIP(3) accumulation and considerably increased the number and the length of neurites in phosphate and tensin homologue-depleted PC12 cells. Further refinement of the computational model predicted Rac1 regulation of PI3-kinase and SHIP2, which was also validated experimentally. We propose that the SHIP2-mediated negative feedback on PIP(3) coordinately works with the PI3-kinase-mediated positive feedback to form an initial protrusive pattern and, later, to punctuate the PIP(3) accumulation to maintain proper neurite outgrowth.


Figures

Figure 1.
Figure 1.
Perturbation of PIP3 production and Rac1/Cdc42 activation with K252a or LY294002 in NGF-stimulated PC12 cells. (A–C) PC12 cells expressing Pippi-PIP3, Raichu-Rac1, or Raichu-Cdc42 were starved for 6 h and then treated with 50 ng/ml NGF. In B and C, the cells were treated with 10 nM K252a (B) or 20 μM LY294002 (C) at 10 min after NGF addition. Images were obtained every 1 min for 30 min after NGF stimulation. Representative ratio images of FRET/CFP at the indicated time points (in minutes) after NGF addition are shown in the intensity-modulated display mode. In the intensity-modulated display mode, eight colors from red to blue are used to represent the FRET/CFP ratio, with the intensity of each color indicating the mean intensity of FRET and CFP. FRET/CFP ratio images were shown after normalization with a reference value acquired from images of unstimulated cells. The upper and lower limits of fold values are shown on the right. Bars, 10 μm. (D–F) The mean FRET/CFP ratios over the whole cell are expressed by measuring the relative increase as compared with the reference value, which was averaged over 10 min before NGF addition. The blue, red, or green line indicates the result of treatment with NGF (N), NGF followed by K252a (N→K), or NGF followed by LY294002 (N→LY), respectively. The number of experiments is as follows: (D) PIP3 (N, n = 6; N→K, n = 11; N→L, n = 11), (E) Rac1 (N, n = 11; N→K, n = 9; N→L, n = 5), (F) Cdc42 (N, n = 9; N→K, n = 5; N→L, n = 5). Error bars show SD.
Figure 2.
Figure 2.
PI(3,4)P2 production during NGF stimulation and in silico analysis of the NGF–PIP3–Rac1 signaling cascade. (A) PC12 cells expressing Pippi-PI(3,4)P2 were stimulated with NGF. Then, the cells were either untreated (top) or treated with K252a (middle) or LY294002 (bottom) at 10 min after NGF addition. Representative images of normalized FRET/CFP ratios of Pippi-PI(3,4)P2 are shown at the indicated time points (in minutes) as described in the legend to Fig. 1 (A–C). Bars, 10 μm. (B) The means of normalized FRET/CFP ratios of Pippi-PI(3,4)P2 (N, n = 10; N→K, n = 9; N→LY, n = 9) are expressed as in the legend to Fig. 1 (D–F). Error bars show SD. (C) Model of the NGF–PIP3–Rac1/Cdc42 signaling cascade. TrkA activates PI3-kinase to generate PIP3, which activates Rac1 and Cdc42. On the other hand, TrkA simultaneously activated PI-5-phosphatase to down-regulate PIP3 levels. In silico, K252a or LY294002 inhibits the binding of PI3-kinase and PI-5-phosphatase to TrkA or PI3-kinase activity, respectively. (D–I) Computer simulations in the model of C are shown for TrkA (D), active PI3-kinase (E), active PI-5-phosphatase (F), PIP3 (G), PI(3,4)P2 (H), and Rac1-GTP (I). TrkA (D) was set to be phosphorylated (purple) upon NGF stimulation at 0 min and then degraded (gray). The blue, red, or green line (E–I) indicates the result of treatment with NGF (N), NGF followed by K252a (N→K), or NGF followed by LY294002 (N→LY), respectively.
Figure 3.
Figure 3.
Depletion of SHIP2 inhibited the K252a-induced decrease in PIP3, Rac1, and Cdc42 to below the basal level. (A) PC12 cells were transfected with an empty pSUPER vector, pSUPER-SHIP2, pSUPER-PTEN, or both pSUPER-SHIP2 and pSUPER-PTEN. After selection with 3 μg/ml puromycin for 2 d, the cells were analyzed by immunoblotting. (B–D) PC12 cells transfected with an empty pSUPER vector (blue line; control), pSUPER-SHIP2 (red line; SHIP2 KD [knockdown]), or pSUPER-PTEN (green line; PTEN KD). After puromycin selection, the cells were further transfected with pPippi-PIP3 (B), pRaichu-Rac1 (C), or pRaichu-Cdc42 (D). After serum starvation for 6 h, the cells were stimulated at 0 min with NGF. Then, K252a was added at 10 min after NGF addition. The means of normalized FRET/CFP ratios are shown as described in the legend to Fig. 1 (D–F). The number of experiments is as follows: (B) PIP3 (control, n = 5; SHIP2 KD, n = 5; PTEN KD, n = 7), (C) Rac1 (control, n = 5; SHIP2 KD, n = 8; PTEN KD, n = 7), (D) Cdc42 (control, n = 5; SHIP2 KD, n = 13; PTEN KD, n = 5). Error bars show SD. (E) In the control (blue), SHIP2-knockdown cells (red), or PTEN-knockdown cells (green), the means of normalized FRET/CFP ratios of Pippi-PI(3,4)P2 after NGF stimulation are shown (control, n = 5; SHIP2 KD, n = 6; PTEN KD, n = 8). Error bars show SD.
Figure 4.
Figure 4.
Increase in Rac1/Cdc42 activity and PIP3 production by depletion of SHIP2 and PTEN. (A) PC12 cells were transfected with pSUPER vector (top) or both pSUPER-SHIP2 and pSUPER-PTEN (bottom). After selection with puromycin, the cells were further transfected with pRaichu-Rac1. After serum starvation, images were obtained for 30 min after NGF stimulation. Representative images of the normalized FRET/CFP ratios at the indicated time points (in minutes) are shown as described in the legend to Fig. 1 (A–C). Bars, 10 μm. (B–D) In control (blue), SHIP2-knockdown (SHIP2 KD; red), PTEN-knockdown (PTEN KD; green), or SHIP2 and PTEN double-knockdown cells (S + P KD; orange), the means of normalized FRET/CFP ratios of Rac1 (B), Cdc42 (C), and PIP3 (D) are expressed as in the legend to Fig. 1 (D–F). The number of experiments is as follows: (B) control, n = 6; SHIP2 KD, n = 6; PTEN KD, n = 8; S + P KD, n = 5; (C) control, n = 5; SHIP2 KD, n = 5; PTEN KD, n = 5; S + P KD, n = 5; (D) control, n = 6; SHIP2 KD, n = 7; PTEN KD, n = 7; S + P KD, n = 6. Error bars show SD. (E and F) NGF-dependent translocation of GRP-EGFP from the cytosol to the plasma membrane was imaged. In the control (E) or SHIP2 and PTEN double-knockdown cells (F), the localization of GRP-EGFP (top) and RFP-NES (middle) were shown at the indicated time points after NGF stimulation. Total fluorescent intensity of RFP over the whole cell was normalized to that of GFP. These two images were used to obtain the raw number of translocated proteins. Ratio images of GFP/normalized RFP are shown in the intensity-modulated display mode (bottom). Upper and lower limits of ratio images are 1.5 and 0.5, respectively. (G) In control (blue), SHIP2-knockdown (red), PTEN-knockdown (green), or SHIP2 and PTEN double-knockdown cells (orange), the amount of PIP3 is plotted against time. The amount of PIP3 was obtained as an asymptotic value using the raw number of translocated proteins based on the theoretical model.
Figure 5.
Figure 5.
NGF-dependent negative feedback loop. (A) Schematic diagram of the NGF-dependent positive and negative feedback loops. (B and C) Results of computer simulation for PIP3 based on the models of Fig. 2 C (B) and Fig. 5 A (C). In knockdown cells, 80% of SHIP2 and/or PTEN was depleted in silico. The blue, red, green, or orange line indicates the control, SHIP2-knockdown (SHIP2 KD), PTEN-knockdown (PTEN KD), or SHIP2 and PTEN double-knockdown cells (S + P KD), respectively. (D–F) In silico (D) or in vivo (E and F) effects of the expression of Rac1N17 on PI(3,4)P2. (E) In control (blue; n = 8) or Rac1N17-expressing cells (red; n = 8), the means of normalized FRET/CFP ratios of Pippi-PI(3,4)P2 are shown as described in the legend to Fig. 1 (D and E). Error bars show SD. (F) Representative images of normalized FRET/CFP ratios of Pippi-PI(3,4)P2 in the control (top) or Rac1N17-expressing cells (bottom) are shown at the indicated time points (in minutes). The Rac1N17-expressing cells were identified by a red fluorescence derived from dsFP593. Bars, 10 μm. (G–I) In silico (G) or in vivo (H and I) effects of the Rac1N17 expression on PIP3. (H) In control (blue; n = 6) or Rac1N17-expressing cells (red; n = 5), the means of normalized FRET/CFP ratios of Pippi-PIP3 are shown. Error bars show SD. (F) Representative images of normalized FRET/CFP ratios of Pippi-PIP3 in the control (top) or Rac1N17-expressing cells (bottom) are shown at the indicated time points (in minutes). Bars, 10 μm.
Figure 6.
Figure 6.
Increase in the number and the length of neurites by depletion of SHIP2 and PTEN. PC12 cells were transfected with the indicated pSUPER constructs and incubated with puromycin for 2 d. The selected cells were then cultured with NGF for 60 h and fixed for microscopy. (A) Representative phase-contrast images of control (top left), SHIP2-knockdown (top right), PTEN-knockdown (bottom left), and SHIP2 and PTEN double-knockdown cells (bottom right). Bars, 50 μm. (B) Cells having neurites whose lengths were twofold longer than their cell body lengths were scored as neurite bearing. At least 50 cells were counted in each experiment, and the experiments were repeated three times. The results are expressed as the mean percentage of neurite-bearing cells with SD. (C) The number of neurites in neurite-bearing cells was divided into six segments, as indicated under the horizontal axis. A histogram plotting the percentage of cell number in each segment is presented for control (blue; n = 173), SHIP2-knockdown (red; n = 143), PTEN-knockdown (green; n = 135), and double-knockdown (orange; n = 182) cells. (D) A bar graph shows the mean length of the longest neurites in the neurite-bearing cells with SEM. The neurite length in the control cells was taken as 100%. The number of cells analyzed in each experiment is as follows: control, n = 106; SHIP2 knockdown, n = 96; PTEN knockdown, n = 75; double knockdown, n = 74. (E) The length of neurites in neurite-bearing cells was divided into six segments, as indicated under the horizontal axis. A histogram plotting the percentage of cell number in each segment is presented as in C.
Figure 7.
Figure 7.
NGF-dependent positive feedback loop. (A) LDR and FKBP (blue) or FKBP-Tiam1 (red) were transfected with pRaichu-Rac1 (left), pPippi-PIP3 (middle), or pPippi-PI(3,4)P2 (right). After serum starvation, the cells were treated with 50 nM rapamycin. The means of normalized FRET/CFP ratios are shown as described in the legend to Fig. 1 (D and E). The number of experiments is as follows: Rac1 (FKBP, n = 3; FKBP-Tiam1, n = 7), PIP3 (FKBP, n = 5; FKBP-Tiam1, n = 7), PI(3,4)P2 (FKBP, n = 6; FKBP-Tiam1, n = 8). Error bars indicate SD. (B) PC12 cells expressing LDR, FKBP-Tiam1, and the indicated FRET probe were serum starved, stimulated with NGF, and treated with rapamycin at 15 min after NGF addition. Representative images of normalized FRET/CFP ratios of Rac1 (top), PIP3 (middle), and PI(3,4)P2 (bottom) are shown at the indicated time points (in minutes). Bars, 10 μm. (C) PC12 cells expressing LDR, FKBP (blue), or FKBP-Tiam1 (red) and the indicated FRET probe were serum starved, stimulated with NGF, and treated with rapamycin at 15 min after NGF addition. The means of normalized FRET/CFP ratios of Rac1 (left), PIP3 (middle), and PI(3,4)P2 (right) are shown. The number of experiments is as follows: Rac1 (FKBP, n = 10; FKBP-Tiam1, n = 5), PIP3 (FKBP, n = 7; FKBP-Tiam1, n = 8), PI(3,4)P2 (FKBP, n = 8; FKBP-Tiam1, n = 6). Error bars indicate SD. (D) Results of computer simulation for Rac1 (left), PIP3 (middle), and PI(3,4)P2 (right) are shown. Blue or red lines indicate the results of NGF addition (at 0 min) followed by rapamycin treatment (at 15 min) in FKBP- or FKBP-Tiam1–expressing cells, respectively.
Figure 8.
Figure 8.
Mechanism of determining neurite-budding sites in PC12 cells. (A) In response to NGF, NGF/TrkA signaling drives a cycling of positive and negative feedback loops to control spatiotemporal PIP3 level and Rac1/Cdc42 activity. All reactions and parameters are listed in Fig. S3 (available at http://www.jcb.org/cgi/content/full/jcb.200609017/DC1). (B and C) PC12 cells expressing Vav2-PAGFP, SHIP2-PAGFP, or PTEN-PAGFP were treated with NGF for 3–30 min. At time 0, PA-GFP proteins in a region of interest in NGF-induced protrusions were photoactivated by UV irradiation (Fig. S5, G and H). (B) Mean of relative fluorescence intensities in the region of interest after photoactivation (PA) was plotted with SD. In C, the bars represent the mean ± SD of time constant (1/e) of Vav2-PAGFP (red; n = 5), SHIP2-PAGFP (blue; n = 8), and PTEN-PAGFP (green; n = 7). (D) A hypothetical model of neuritogenesis in PC12 cells. During initial neuritogenesis, positive and negative feedback loops at cell periphery generate a local activation of PI3-kinase (red) and a long-range activation of SHIP2 (blue), respectively. PTEN activity is uniformly distributed (green). As a result, a sharp peak of PIP3 level and Rac1/Cdc42 activity (purple) is generated and promotes the budding of neurites.

Similar articles

Cited by

References

    1. Aoki, K., T. Nakamura, and M. Matsuda. 2004. Spatio-temporal regulation of Rac1 and Cdc42 activity during nerve growth factor-induced neurite outgrowth in PC12 cells. J. Biol. Chem. 279:713–719. - PubMed
    1. Aoki, K., T. Nakamura, K. Fujikawa, and M. Matsuda. 2005. Local phosphatidylinositol 3,4,5-trisphosphate accumulation recruits Vav2 and Vav3 to activate Rac1/Cdc42 and initiate neurite outgrowth in nerve growth factor-stimulated PC12 cells. Mol. Biol. Cell. 16:2207–2217. - PMC - PubMed
    1. Bhalla, U.S. 2004. Models of cell signaling pathways. Curr. Opin. Genet. Dev. 14:375–381. - PubMed
    1. Bourne, H.R., and O. Weiner. 2002. A chemical compass. Nature. 419:21. - PubMed
    1. Cantley, L.C. 2002. The phosphoinositide 3-kinase pathway. Science. 296:1655–1657. - PubMed

Publication types

MeSH terms

Substances