Comparative Study
. 2007 Jun 11;204(6):1405-16.
doi: 10.1084/jem.20062363. Epub 2007 May 29.

Immunization with vaccinia virus induces polyfunctional and phenotypically distinctive CD8(+) T cell responses

Affiliations
Comparative Study

Immunization with vaccinia virus induces polyfunctional and phenotypically distinctive CD8(+) T cell responses

Melissa L Precopio et al. J Exp Med. .

Abstract

Vaccinia virus immunization provides lifelong protection against smallpox, but the mechanisms of this exquisite protection are unknown. We used polychromatic flow cytometry to characterize the functional and phenotypic profile of CD8(+) T cells induced by vaccinia virus immunization in a comparative vaccine trial of modified vaccinia virus Ankara (MVA) versus Dryvax immunization in which protection was assessed against subsequent Dryvax challenge. Vaccinia virus-specific CD8(+) T cells induced by both MVA and Dryvax were highly polyfunctional; they degranulated and produced interferon gamma, interleukin 2, macrophage inflammatory protein 1beta, and tumor necrosis factor alpha after antigenic stimulation. Responding CD8(+) T cells exhibited an unusual phenotype (CD45RO(-)CD27(intermediate)). The unique phenotype and high degree of polyfunctionality induced by vaccinia virus also extended to inserted HIV gene products of recombinant NYVAC. This quality of the CD8(+) T cell response may be at least partially responsible for the profound efficacy of these vaccines in protection against smallpox and serves as a benchmark against which other vaccines can be evaluated.


Figures
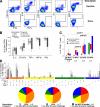
Figure 1.
Figure 1.
Vaccinia virus–specific CD8+ T cells are highly polyfunctional. (A) Representative example of the gating strategy used to define 31 functional response combinations of CD8+ T cells. Single function gates were set based on negative control (unstimulated) samples and were placed consistently across samples. (B) The percentage of the total CD8+ T cell response is shown. The frequency of CD8+ T cells expressing each function was divided by the frequency of the total response. All MVA dose groups were combined into one group for analysis. (C) Magnitude of CD8+ T cell responses before and after Dryvax challenge in each preimmunization group. (D) Functional composition of the CD8+ T cell response. Every possible combination of responses is shown on the x axis. Responses are grouped and color coded according to the number of functions. The data are summarized by the pie charts, in which each slice of the pie represents the fraction of the total response that consists of CD8+ T cells positive for a given number of functions. All MVA dose groups were combined into one group for analysis (as in B). Boxes represent interquartile ranges; mean and SD lines are shown. Bars indicate the percentage of the total response contributed by CD8+ T cells with a given functional response.
Figure 2.
Figure 2.
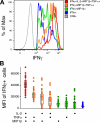
Polyfunctional cells make more IFN-γ per cell than monofunctional cells. (A) IFN-γ fluorescence of CD8+ T cells with different functional properties. Representative example from one individual. (B) Compiled IFN-γ MFI of CD8+ T cells of all cytokine combinations (n = 24). Boxes represent interquartile ranges; means and SDs are indicated (note that the average MFI for the IFN-γ populations is 446).
Figure 3.
Figure 3.
Vaccinia virus–specific CD8+ T cells have an unusual phenotype. (A) Several surface markers were included in the multicolor flow cytometry panel to define the phenotypes of vaccinia virus–specific CD8+ T cells. To incorporate these markers into the panel, responding cells were identified by staining with Alexa Fluor 680–CD107a and IFN-γ, TNF-α, or IL-2 (each conjugated to APC). A CD27-PE antibody conjugate was used to allow for the best discrimination of expression. The phenotype of CD107a+cytokine+ CD8+ T cells is shown as a red contour plot overlayed on a density plot of the total CD8+ T cell population at 1 and 5 mo after Dryvax challenge in a representative individual from the MVA immunization group. (B) The vaccinia virus–specific CD8+ T cell phenotype is similar among cells of different functional properties. 5+ (CD107a+IFN-γ+IL-2+ MIP-1β+TNF-α+), 4+ (CD107a+IFN-γ+IL-2MIP-1β+TNF-α+), and 3+ (CD107aIFN-γ+IL-2MIP-1β+TNF-α+) CD8+ T cells are overlayed as contour plots on density plots of the total CD8+ T cell population.
Figure 4.
Figure 4.
The unusual phenotype of vaccinia virus–specific CD8+ T cells is not a consequence of in vitro stimulation. (A) Representative KVD, CLT, and ILD tetramer staining of HLA-A2+ vaccinees after Dryvax challenge plotted as tetramer versus side scatter–area (SSC-A). Numbers indicate the percentage of CD8+ T cells that are tetramer positive. CD27 and CD45RO expression on tetramer-binding cells is shown as red contour plots overlayed on density plots of the total CD8+ T cell population. (B) PBMCs from HLA-A2+ vaccinees were stimulated with peptide for 6 h or vaccinia virus for 9 h. Data from a representative stimulation with KVD is displayed (as in Fig. 1 D). The phenotype of vaccinia virus–specific CD8+ T cells is shown as a red contour plot overlayed on a density plot of the total CD8+ T cell population. To best separate the CD27 high, intermediate, and low populations, a PE-conjugated antibody was used for staining. To accommodate this change from the standard antibody panel, the anti–MIP-1β antibody was omitted. Therefore, the contour plot shows the phenotype of CD107a+IFN-γ+IL-2+TNF-α+ CD8+ T cells, which (as shown by the bar graph) also produce MIP-1β. (C) PBMCs from HIV-1–infected individuals were stimulated for 6 h with overlapping Gag peptides or for 9 h with Gag recombinant vaccinia virus. Data from a representative individual is shown. The contour plots show the phenotype of CD107a+IFN-γ+IL-2TNF-α+ CD8+ T cells.
Figure 5.
Figure 5.
Clonal analysis of sorted CD8+ T cells specific for KVD at 1 and 3 mo after Dryvax. CDR3 amino acid sequence and percent frequency and TCRBJ usage are shown for each clonotype defined by its CDR3. Sequences with identical amino acid residues are shown in color. Tetramer frequencies are shown as a percentage of total CD8+ T cells. Data are from one individual.
Figure 6.
Figure 6.
Vaccinia virus–specific CD8+ T cells express intracellular granzymes and perforin. Perforin and granzyme expression on KVD tetramer-binding cells is shown as red contour plots overlayed on density plots of the total CD8+ T cell population. An APC-conjugated tetramer was used in A; a PE-conjugated tetramer was used in B. Representative staining from one of three donors.
Figure 7.
Figure 7.
Env-specific CD8+ T cells induced by an HIV recombinant vaccinia virus are highly polyfunctional. Functional composition of the CD8+ T cell response specific for the vaccinia virus vector and Env insert displayed (as in Fig. 1 D). The phenotype of 5+ (CD107a+IFN-γ+IL-2+TNF-α+MIP-1β+) CD8+ T cells from one representative individual is shown as red contour plots overlayed on density plots of the total CD8+ T cell population. Mean bars and SD lines are shown.

References

    1. Edghill-Smith, Y., H. Golding, J. Manischewitz, L.R. King, D. Scott, M. Bray, A. Nalca, J.W. Hooper, C.A. Whitehouse, J.E. Schmitz, et al. 2005. Smallpox vaccine-induced antibodies are necessary and sufficient for protection against monkeypox virus. Nat. Med. 11:740–747. - PubMed
    1. Riddell, S.R., and P.D. Greenberg. 1995. Principles for adoptive T cell therapy of human viral diseases. Annu. Rev. Immunol. 13:545–586. - PubMed
    1. Jin, X., D.E. Bauer, S.E. Tuttleton, S. Lewin, A. Gettie, J. Blanchard, C.E. Irwin, J.T. Safrit, J. Mittler, L. Weinberger, et al. 1999. Dramatic rise in plasma viremia after CD8+ T cell depletion in simian immunodeficiency virus–infected macaques. J. Exp. Med. 189:991–998. - PMC - PubMed
    1. Schmitz, J.E., M.J. Kuroda, S. Santra, V.G. Sasseville, M.A. Simon, M.A. Lifton, P. Racz, K. Tenner-Racz, M. Dalesandro, B.J. Scallon, et al. 1999. Control of viremia in simian immunodeficiency virus infection by CD8+ lymphocytes. Science. 283:857–860. - PubMed
    1. Koup, R.A., J.T. Safrit, Y. Cao, C.A. Andrews, Y. Wu, G. McLeod, W. Borkowsky, C. Farthing, and D.D. Ho. 1994. Temporal association of cellular immune response with the initial control of viremia in primary HIV-1 syndrome. J. Virol. 68:4650–4655. - PMC - PubMed

Publication types