. 2007 Aug;92(8):3268-77.
doi: 10.1210/jc.2007-0642. Epub 2007 May 29.

Molecular evidence for a link between the N363S glucocorticoid receptor polymorphism and altered gene expression

Affiliations

Molecular evidence for a link between the N363S glucocorticoid receptor polymorphism and altered gene expression

Christine M Jewell et al. J Clin Endocrinol Metab. 2007 Aug.

Abstract

Context: A single-nucleotide polymorphism (SNP) in the human glucocorticoid receptor (hGR) N363S (rs6195) has been the focus of several clinical studies, and some epidemiological data link this SNP to increased glucocorticoid sensitivity, coronary artery disease, and increased body mass index. However, molecular studies in vitro using reporter gene expression systems have failed, for the most part, to define a link between this polymorphism and altered glucocorticoid receptor function.

Objective: The objective of this study was to address the biological relevancy of N363S SNP in GR function by establishing stable U-2 OS (human osteosarcoma) cell lines expressing wild-type hGR or N363S and examining these receptors under a variety of conditions that probe for GR activity including human gene microarray analysis.

Design: Functional assays with reporter gene systems, Western blotting, and human microarray analysis were used to evaluate the activity of wild-type and N363S GR in both transiently and stably expressing cells. In addition, quantitative RT-PCR was used to confirm the microarray analysis.

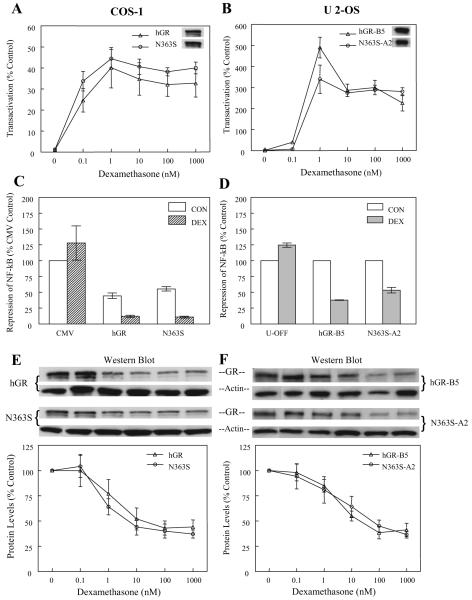
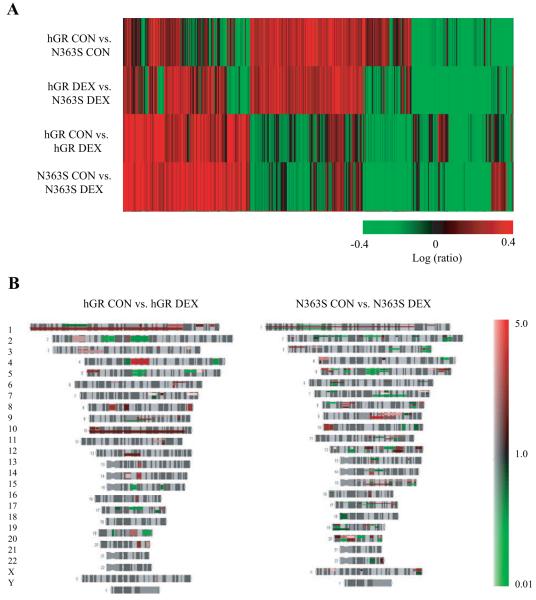
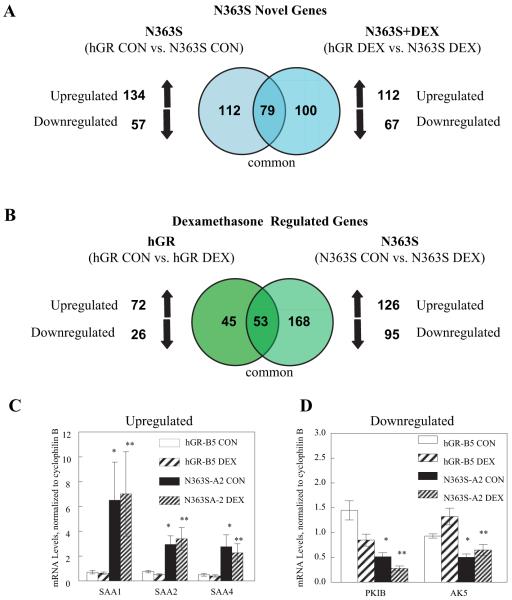
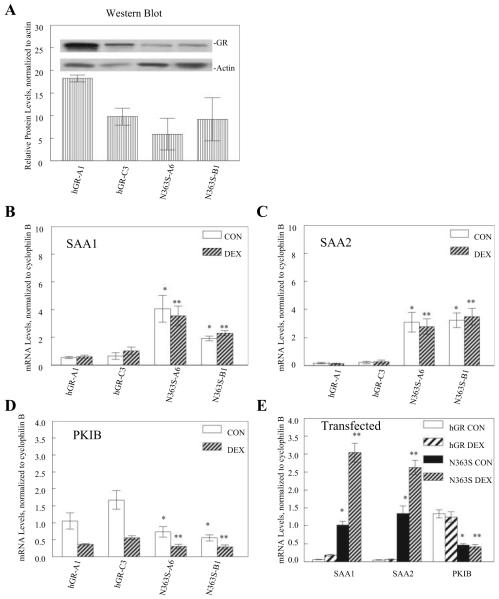
Results: Functional assays with reporter gene systems and homologous down-regulation revealed only minor differences between the wild-type hGR and N363S receptors in both transiently and stably expressing cell lines. However, examination of the two receptors by human gene microarray analysis revealed a unique gene expression profile for N363S.

Conclusions: These studies demonstrate that the N363S SNP regulates a novel set of genes with several of the regulated genes supporting a potential role for this GR polymorphism in human diseases.


Figures

Fig. 1
Fig. 1
Functional analysis of N363S. A, COS-1 cells were transfected with either wild-type hGR or N363S and the glucocorticoid-responsive promoter GRE2-TATA-Luc. Eighteen hours after transfection, the cells were treated with concentrations of dexamethasone ranging from 0-1000 nm for 24 h. Data are presented as percent activity over the 0 nm dexamethasone (vehicle) control (n = 3). The inset shows a representative Western blot of wild-type hGR and the variant probed with anti-GR antibody (no. 57). B, U-2 OS stable cell lines hGR-B5 and N363S-A2 were transfected with the glucocorticoid-responsive promoter GRE2-TATA-Luc and treated with dexamethasone as for COS-1 (n = 3). C, COS-1 cells were transfected with the NF-κB-responsive promoter, 3XMHCLuc, the NF-κB subunit p65, and wild-type hGR, N363S, or empty vector (CMV). Eighteen hours after transfection, the cells were treated with 100 nm dexamethasone or vehicle for 24 h. Data are presented as 100% of the vehicle-treated control (p65 with the empty CMV vector) (n = 3). D, Repression of NF-κB was assayed in the stable cell lines by transfecting the parental cell line U-OFF or hGR-B5 or N363S-A2 with the NF-κB-responsive promoter 3XMHCLuc and the NF-κB subunit p65 and then treated as for COS-1. Here the hormone-mediated repression of p65 is compared with the vehicle controls set at 100% (n = 3). E, Down-regulation of the GR protein was assessed by transfecting COS-1 cells with either wild-type hGR or N363S. After treatment with increasing concentrations of dexamethasone ranging from 0-1000 nm for 24 h, proteins were isolated, and protein levels were assessed by Western blotting with anti-GR antibody (no. 57) and anti-β-actin. The Western blot pictured is one blot representative of three. To generate the graph, protein levels were normalized to actin and the 0 nm dexamethasone (vehicle) controls set at 100% (n = 3). F, Down-regulation of the hGR-B5 and N363S-A2 stably expressed proteins was assayed by Western blot after treatment of the cells with increasing concentrations of dexamethasone (0-1000 nm) for 24 h. Protein extracts were prepared, and Western blotting and data analysis were performed as for COS-1 (n = 3).
Fig. 2
Fig. 2
Microarray analysis of N363S. hGR-B5 and N363S-A2 cells were treated with 10 nm dexamethasone or vehicle (control) for 6 h. Total RNA was isolated and submitted for microarray analysis. Each experimental hybridization consisted of four comparison groups: hGR CON (vehicle control) vs. N363S CON; hGR DEX (treated with 10 nm dexamethasone) vs. N363S DEX; hGR CON vs. hGR DEX; and N363S CON vs. N363SDEX. The data generated were analyzed by selecting genes that were differentially regulated at P < 0.001 and common between two independent experiments. A, Cluster analysis of these common genes. Those in green are down-regulated, and those in red are up-regulated. B, Chromosome mapping.
Fig. 3
Fig. 3
Venn diagram analysis and quantitative RT-PCR confirmation of N363S-regulated genes. A, Common gene lists generated from the microarray analysis were compared using Venn diagrams. Genes regulated by N363S over wild-type hGR (hGR CON vs. N363S CON) (left-hand circle) are compared with those treated with 10 nm dexamethasone (hGR DEX vs. N363S DEX) (right-hand circle). The overlapping circle represents genes that are common to N363S and N363S and dexamethasone. B, This Venn diagram compares the effects of dexamethasone on genes regulated by the expression of wild-type hGR vs. N363S. The left-hand circle shows wild-type hGR-expressing cells treated with 10 nm dexamethasone compared with the vehicle-treated (control) cells (hGR CON vs. hGR DEX). The right-hand circle displays genes regulated by N363S-expressing cells treated with 10 nm dexamethasone compared with vehicle-treated (N363S CON vs. N363S DEX). The overlapping circle represents genes common to both the wild-type and N363S-treated cells. C and D, Total RNA was isolated from either wild-type hGR-B5 or N363S-A2 stably expressing cell lines treated with 10 nm dexamethasone or vehicle for 6 h. Quantitative RT-PCR was performed using the 7900HT sequence detection system predesigned primer/probe sets available from Applied Bio-systems. Each primer/probe set was analyzed in duplicate or triplicate and with three different sets of RNAs. mRNA levels were normalized to the endogenous gene cyclophilin B and averaged with sem. Independent t tests were performed comparing N363S-A2 CON to hGR-B5 CON (*) and N363S-A2 DEX to hGR-B5 DEX (**). C, Verification of N363S highly up-regulated genes, which included the SAA gene family members SAA1 (*, P < 0.09; **, P < 0.09), SAA2 (*, P < 0.009; **, P < 0.009), and SAA4 (*, P < 0.03; **, P < 0.03). D, Verification of two of the N363S down-regulated genes including PKIB (*, P < 0.001; **, P < 0.001) and AK5 (*, P < 0.001; **, P < 0.01).
Fig. 4
Fig. 4
Quantitative RT-PCR analysis of other U-2 OS cell lines stably or transiently expressing wild-type hGR or N363S. A, GR expression levels in the stable cell lines hGR-A1, hGR-C3, N363S-A6, and N363S-B1 were assessed by Western blotting protein extracts with anti-GR antibody (no. 57) and anti-β-actin and is representative of two (inset). The protein levels were quantitated using the NIH Image program, and GR protein levels were normalized to those of β-actin. The graph depicts the relative protein levels of each cell line (n = 2). B-D, Total RNA was isolated from cell lines treated with 10 nm dexamethasone (DEX) or vehicle (CON), and quantitative RT-PCR was performed as described. mRNA levels were normalized to the endogenous gene cyclophilin B and averaged with sem. Independent t tests were performed comparing N363S-A6 CON and N363S-B1 CON to hGR-A1 CON and hGR-C3 CON (*) and N363S-A6 DEX and N363S-B1 DEX to hGR-A1 DEX and hGR-C3 DEX (**). B and C, Verification of up-regulation of SAA1 (*, P < 0.001; **, P < 0.005) (B) and SAA2 (*, P < 0.005; **, P < 0.001) (C); D, down-regulation of PKIB (*, P < 0.01; **, P < 0.01 compared with hGR-C3) by N363S stably expressing cell lines. E, U-2 OS cells were transiently transfected with either wild-type hGR or N363S and treated with 10 nm dexamethasone or vehicle for 6 h. Total RNA was isolated, and quantitative RT-PCR and analyses were performed as described above: SAA1 (*, P < 0.0001; **, P < 0.0001), SAA2 (*, P < 0.0001; **, P < 0.0001), and PKIB (*, P < 0.001; **, P < 0.005).

References

    1. Rhen T, Cidlowski JA. Antiinflammatory action of glucocorticoids: new mechanisms for old drugs. N Engl J Med. 2005;353:1711–1723. - PubMed
    1. DeRijk RH, Schaaf M, de Kloet ER. Glucocorticoid receptor variants: clinical implications. J Steroid Biochem Mol Biol. 2002;81:103–122. - PubMed
    1. Rosmond R, Dallman MF, Bjorntorp P. Stress-related cortisol secretion in men: relationships with abdominal obesity and endocrine, metabolic, and hemodynamic abnormalities. J Clin Endocrinol Metab. 1998;83:1853–1859. - PubMed
    1. Huizenga NA, Koper JW, de Lange P, Pols HA, Stolk RP, Grobbee DE, de Jong FH, Lamberts SW. Interperson variability but intraperson stability of baseline plasma cortisol concentrations, and its relation to feedback sensitivity of the hypothalamo-pituitary-adrenal axis to a low dose of dexamethasone in elderly individuals. J Clin Endocrinol Metab. 1998;83:47–54. - PubMed
    1. Karl M, Lamberts SW, Detera-Wadleigh SD, Encio IJ, Stratakis CA, Hurley DM, Accili D, Chrousos GP. Familial glucocorticoid resistance caused by a splice site deletion in the human glucocorticoid receptor gene. J Clin Endocrinol Metab. 1993;76:683–689. - PubMed

Publication types

MeSH terms