. 2007 May 30:7:28.
doi: 10.1186/1472-6750-7-28.

Physiological evaluation of the filamentous fungus Trichoderma reesei in production processes by marker gene expression analysis

Affiliations

Physiological evaluation of the filamentous fungus Trichoderma reesei in production processes by marker gene expression analysis

Jari J Rautio et al. BMC Biotechnol. .

Abstract

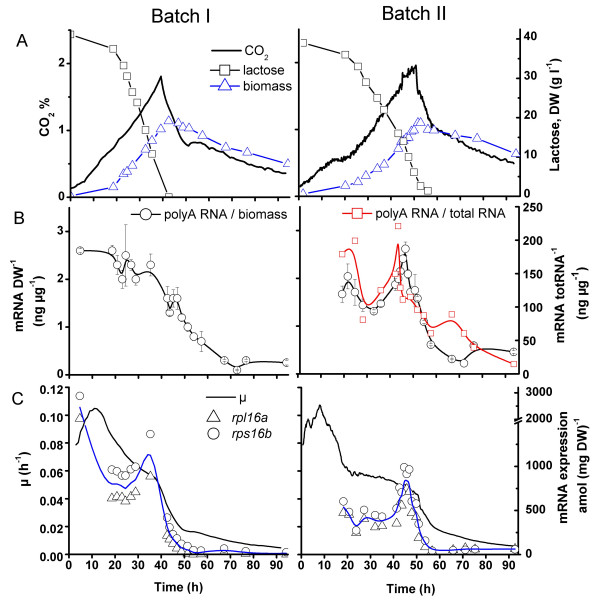
Background: Biologically relevant molecular markers can be used in evaluation of the physiological state of an organism in biotechnical processes. We monitored at high frequency the expression of 34 marker genes in batch, fed-batch and continuous cultures of the filamentous fungus Trichoderma reesei by the transcriptional analysis method TRAC (TRanscript analysis with the aid of Affinity Capture). Expression of specific genes was normalised either with respect to biomass or to overall polyA RNA concentration. Expressional variation of the genes involved in various process relevant cellular functions, such as protein production, growth and stress responses, was related to process parameters such as specific growth and production rates and substrate and dissolved oxygen concentrations.

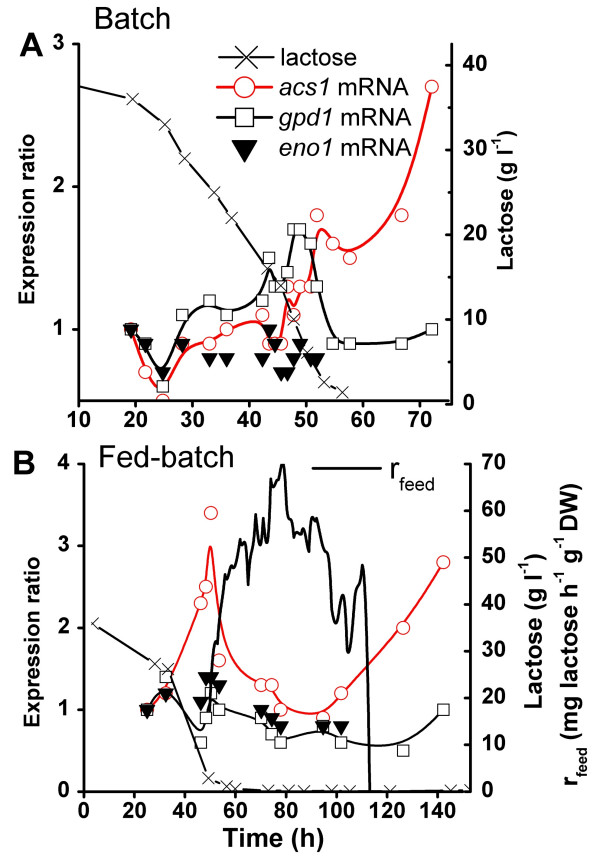
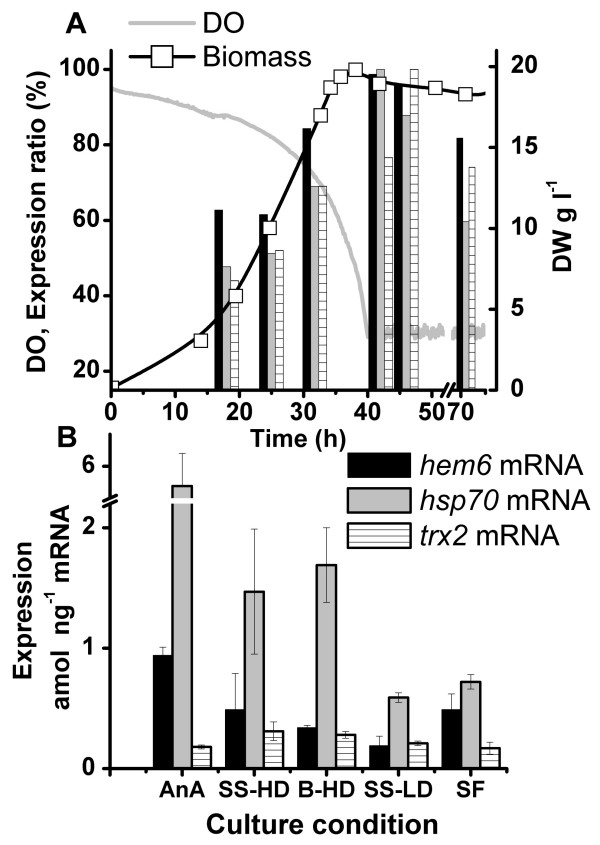
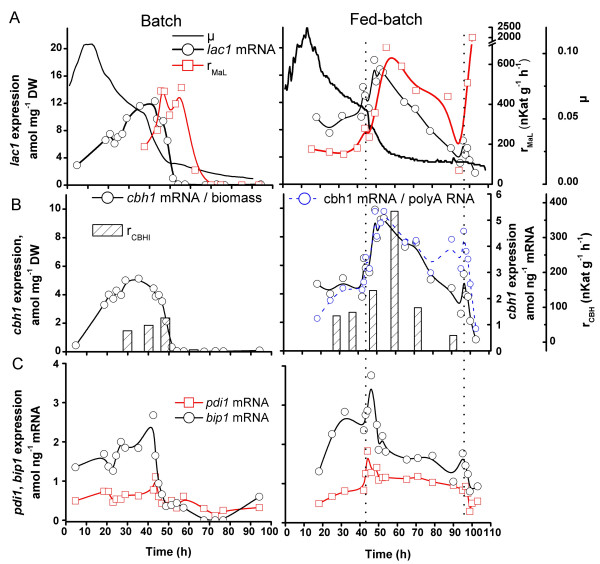
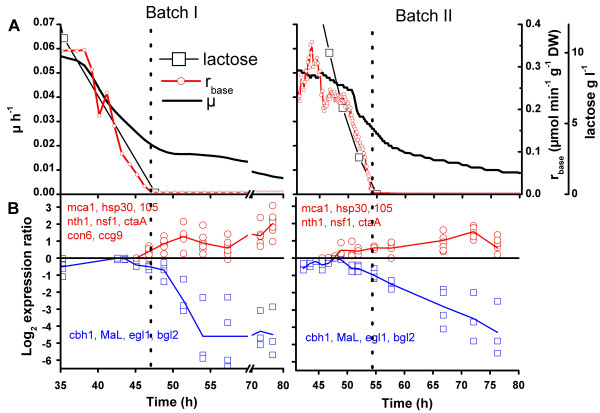
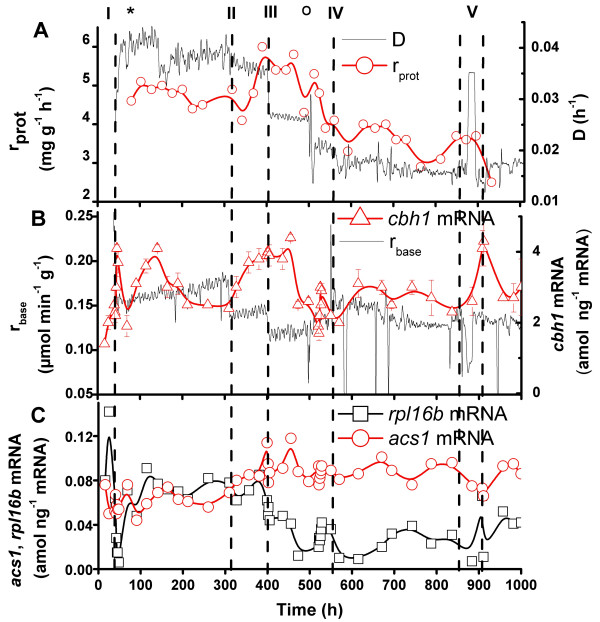
Results: Gene expression of secreted cellulases and recombinant Melanocarpus albomyces laccase predicted the trends in the corresponding extracellular enzyme production rates and was highest in a narrow "physiological window" in the specific growth rate (micro) range of 0.03-0.05 h-1. Expression of ribosomal protein mRNAs was consistent with the changes in mu. Nine starvation-related genes were found as potential markers for detection of insufficient substrate feed for maintaining optimal protein production. For two genes induced in anaerobic conditions, increasing transcript levels were measured as dissolved oxygen decreased.

Conclusion: The data obtained by TRAC supported the usefulness of focused and intensive transcriptional analysis in monitoring of biotechnical processes providing thus tools for process optimisation purposes.


Figures

Figure 1
Figure 1
PolyA RNA and ribosomal protein mRNA levels in twobatch cultures of T. reesei. A. Lactose, biomass and CO2 concentrations in batch cultures I and II. B. PolyA RNA concentration relative to biomass in cultures I and II and polyA RNA concentration relative to total RNA in culture II. C. Specific growth rate (μ) and expression of two ribosomal protein mRNAs (rpl16a, rps16b) relative to biomass. Cultures were maintained at 28°C and pH 5.5 – 6.
Figure 2
Figure 2
Expression of carbohydrate metabolism marker genes in a batch culture (A) and a fed-batch culture (B) of T. reesei. Lactose concentration, Feed rate of lactose rfeed (mg lactose h-1 g-1 DW), mRNA expression levels of acs1, gpd1 and eno1 relative to expression level measured in the first sample (19.2 h). Expression levels were normalised using polyA RNA.
Figure 3
Figure 3
Expression of oxygen sensitive hem6, hsp70 and trx2 genes in different cultures of T. reesei. Expression of hem6, hsp70 and trx2 genes (A) during batch culture of T. reesei compared with DO and biomass concentration and (B) maximal expression levels of hem6, hsp70 and trx2 measured in an anaerobic culture (AnA, DW 4 g l-1, pO2~0%), steady state with high cell density (SS-HD, DW 16 g l-1, pO2 ~30%) and with low cell density (SS-LD, DW 4 g l-1, pO2 ~80%), in batch cultures with high cell density (B-HD, DW 20 g l-1, pO2 ~30%) and in shake flask precultures (SF, DW ~2 g l-1). Error bars show the standard deviation between triplicate cultures.
Figure 4
Figure 4
Expression of the recombinant M. albomyces laccase gene lac1, the cellulase gene cbh1 and protein folding factor genes pdi1 and bip1 in batch and fed-batch cultures of T. reesei. A. lac1 mRNA level relative to biomass, specific extracellular production rate of laccase rMaL, specific growth rate μ. B. cbh1 mRNA relative to biomass (batch and fed-batch) and relative to polyA RNA (fed-batch) and specific extracellular production rate of CBHI. C. pdi and bip1 mRNA relative to polyA RNA. Dotted, vertical lines in the fed-batch culture represent the start and end of lactose feed.
Figure 5
Figure 5
Responses of marker genes to starvation in two batch cultures (I and II) of T. reesei. A. Specific growth rate μ, lactose concentrations, specific base consumption rate rbase. B. Expression of cellulase and laccase genes as log2 ratio to maximal expression measured in the cultures (blue symbols). Expression of genes showing >2-fold increasing mRNA level relative to polyA RNA after exhaustion of lactose as log2 ratio to the expression level in a sample taken before the observed increase (red symbols).
Figure 6
Figure 6
Expression of cbh1, ribosomal protein mRNA and acs1 in a continuous culture of T. reesei run for 1000 h. A. Culture dilution rate D, specific productivity of extracellular proteins rprot(mg h-1 g-1 DW). B. Specific base consumption rate rbase(μmol min-1 g-1 DW), cbh1 mRNA expression relative to polyA RNA. C. acs1 and rpl16b mRNA expression relative to polyA RNA. I Start of continuous medium feed. II, III Changes of base consumption rate criterion (DELTABAS). IV Reduction in nitrogen provision. V Temperature gradient from 28°C to 24°C. Process disturbances (*) and (O).

Similar articles

Cited by

References

    1. Schuster KC. Monitoring the physiological status in bioprocesses on the cellular level. Adv Biochem Eng Biotechnol. 2000;66:185–208. - PubMed
    1. Perez-Torrado R, Bruno-Barcena JM, Matallana E. Monitoring stress-related genes during the process of biomass propagation of Saccharomyces cerevisiae strains used for wine making. Appl Environ Microbiol. 2005;71:6831–6837. doi: 10.1128/AEM.71.11.6831-6837.2005. - DOI - PMC - PubMed
    1. Schweder T, Hecker M. Monitoring of stress responses. Adv Biochem Eng Biotechnol. 2004;89:47–71. - PubMed
    1. Higgins VJ, Rogers PJ, Dawes IW. Application of genome-wide expression analysis to identify molecular markers useful in monitoring industrial fermentations. Appl Environ Microbiol. 2003;69:7535–7540. doi: 10.1128/AEM.69.12.7535-7540.2003. - DOI - PMC - PubMed
    1. Gasch AP, Spellman PT, Kao CM, Carmel-Harel O, Eisen MB, Storz G, Botstein D, Brown PO. Genomic expression programs in the response of yeast cells to environmental changes. Mol Biol Cell. 2000;11:4241–4257. - PMC - PubMed

Publication types

MeSH terms