. 2007 Aug;81(16):8692-706.
doi: 10.1128/JVI.00527-07. Epub 2007 May 30.

Interferon-mediated immunopathological events are associated with atypical innate and adaptive immune responses in patients with severe acute respiratory syndrome

Affiliations

Interferon-mediated immunopathological events are associated with atypical innate and adaptive immune responses in patients with severe acute respiratory syndrome

Mark J Cameron et al. J Virol. 2007 Aug.

Abstract

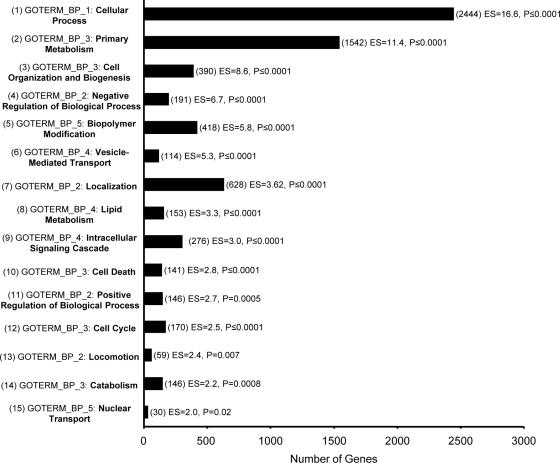
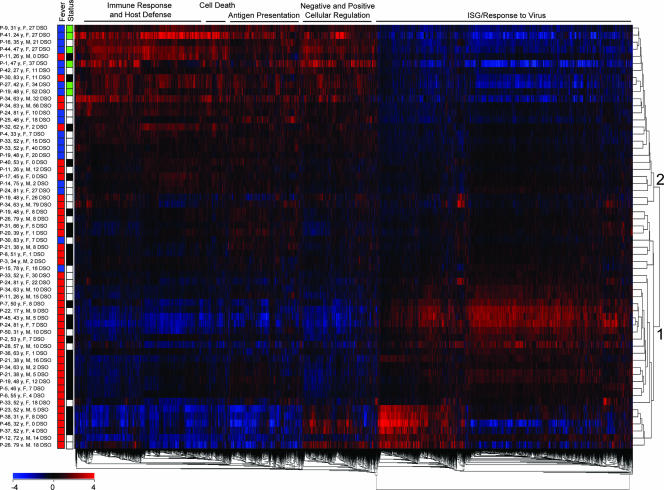
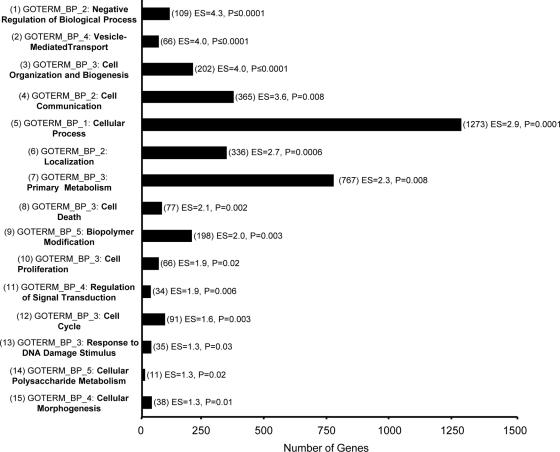
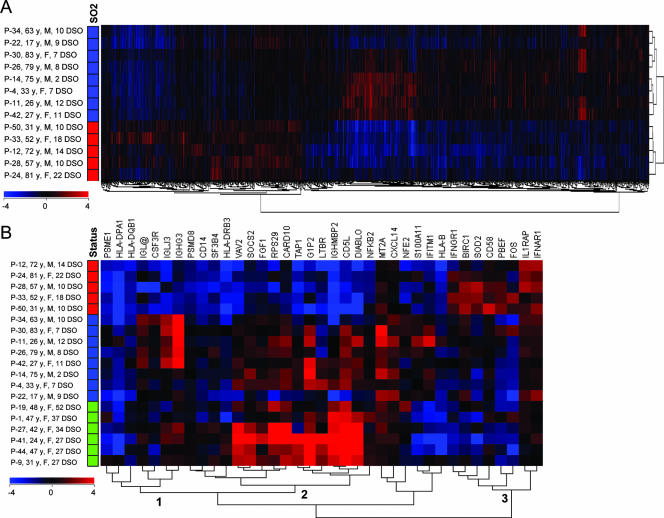
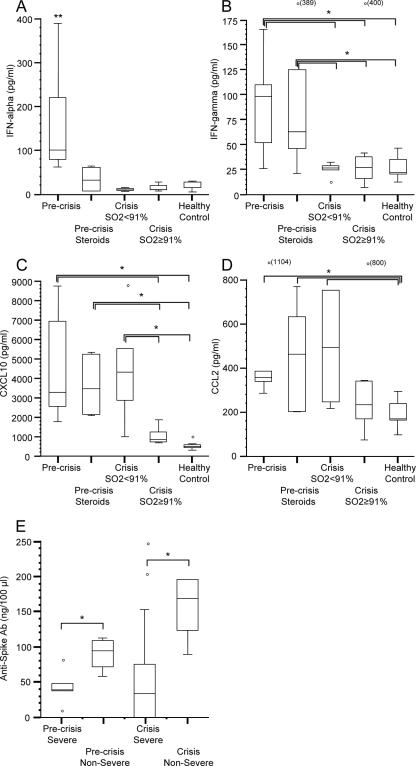
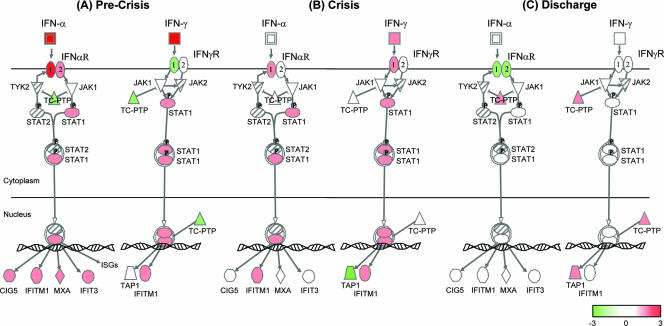
It is not understood how immune inflammation influences the pathogenesis of severe acute respiratory syndrome (SARS). One area of strong controversy is the role of interferon (IFN) responses in the natural history of SARS. The fact that the majority of SARS patients recover after relatively moderate illness suggests that the prevailing notion of deficient type I IFN-mediated immunity, with hypercytokinemia driving a poor clinical course, is oversimplified. We used proteomic and genomic technology to systematically analyze host innate and adaptive immune responses of 40 clinically well-described patients with SARS during discrete phases of illness from the onset of symptoms to discharge or a fatal outcome. A novel signature of high IFN-alpha, IFN-gamma, and IFN-stimulated chemokine levels, plus robust antiviral IFN-stimulated gene (ISG) expression, accompanied early SARS sequelae. As acute illness progressed, SARS patients entered a crisis phase linked to oxygen saturation profiles. The majority of SARS patients resolved IFN responses at crisis and expressed adaptive immune genes. In contrast, patients with poor outcomes showed deviated ISG and immunoglobulin gene expression levels, persistent chemokine levels, and deficient anti-SARS spike antibody production. We contend that unregulated IFN responses during acute-phase SARS may culminate in a malfunction of the switch from innate immunity to adaptive immunity. The potential for the use of the gene signatures we describe in this study to better assess the immunopathology and clinical management of severe viral infections, such as SARS and avian influenza (H5N1), is therefore worth careful examination.


Figures

FIG. 1.
FIG. 1.
General functional annotation clusters identified by microarray analysis of SARS patients with or without fever. A total of 5,555 genes were identified by ANOVA (F-test, P < 0.05) based on the presence or absence of a fever of ≥38°C from 60 data sets for 40 SARS patients throughout illness and were uploaded to the DAVID Bioinformatics Database. A total of 4,559 genes were recognized and mapped for functional annotation analysis. The GO term (GOTERM) member and number of genes associated with the largest category of genes within the cluster are shown for each of the top 15 functional annotation clusters in order of enrichment score (ES). Note that functional annotation clustering reduces, but does not eliminate, overlapping GO annotation, so the total number of genes displayed may exceed the number uploaded. P values refer to a one-tailed Fisher's exact probability value used for gene enrichment analysis by the DAVID system.
FIG. 2.
FIG. 2.
Two-way hierarchical cluster analysis of microarray data sets from SARS patients with or without fever. A total of 5,555 genes were identified by ANOVA (F-test, P < 0.05) based on the presence (red boxes in the “Fever” column) or absence (blue boxes in the “Fever” column) of a fever of ≥38°C from 60 data sets for 40 SARS patients throughout illness. SARS patient data sets were normalized gene by gene against the means for healthy controls (n = 10). Patient data sets were analyzed by two-way hierarchical clustering (red boxes indicate upregulation and blue boxes indicate downregulation of genes of the indicated functions) and labeled by the presence or absence of fever. The general status of a SARS patient (for the “Status” column, black boxes indicate the precrisis phase, white boxes indicate crisis and green boxes indicate patients at discharge) is also noted as defined in the text. The major GO terms according to DAVID for five clusters have been placed above the heat map, and two patient clusters are labeled as described in the text.
FIG. 3.
FIG. 3.
General functional annotation clusters identified by microarray analysis of SARS disease course. ANOVA was performed based on SO2 level at the time of SARS patient sampling during crisis (five patients with an SO2 of <91% and eight patients with an SO2 of ≥91%), resulting in the identification of 2,487 genes (P < 0.05). These genes were then uploaded to the DAVID Bioinformatics Database, and 2,123 were recognized and mapped for functional annotation analysis. The GO term (GOTERM) member and number of genes associated with the largest category of genes within the cluster are shown for each of the top 15 functional annotation clusters in order of enrichment score (ES). P values refer to a one-tailed Fisher's exact probability value used for gene enrichment analysis by the DAVID system.
FIG. 4.
FIG. 4.
Microarray analysis of the SARS disease course. (A) ANOVA was performed based on the SO2 level at the time of SARS patient sampling during crisis (five patients with an SO2 of <91% and eight patients with an SO2 of ≥91%), resulting in the identification of 2,487 genes (P < 0.05). SARS patient data sets, normalized to the means for healthy controls (n = 10), were two-way hierarchically clustered and labeled by SO2 level (red boxes indicate an SO2 of <91% and blue boxes indicate an SO2 of ≥91%). (B) Thirty-seven genes listed in Table 3 were hierarchically clustered alongside patient data sets (n = 19) ordered by the patient's general status at the time (red boxes indicate an SO2 of <91%, blue boxes indicate an SO2 of ≥91%, green boxes indicate patients at discharge). Three clusters discussed in the text are marked.
FIG. 5.
FIG. 5.
Analysis of cytokine and anti-SARS CoV spike Ab levels in the plasma of SARS patients. (A through D) Five patient groups for cytokine analysis were chosen: (i) non-corticosteroid-treated, precrisis SARS (n = 8); (ii) corticosteroid-treated, precrisis SARS (n = 6); (iii) crisis with an SO2 of ≥91% at the time (n = 8); (iv) crisis with an SO2 of <91% at the time (n = 5); and (v) healthy controls (n = 10). The box-and-whisker plots present the 50% interquartile ranges, maximum values excluding outliers (o), and medians. There were no significant differences in protein levels between healthy controls and SARS patients at discharge (data not shown). (E) Four patient groups emerged during analysis of plasma anti-SARS spike Ab levels: (i) precrisis severe-SARS patients (n = 5; median age, 57 years); (ii) precrisis nonsevere-SARS patients (n = 4; median age, 37 years); (iii) severe-SARS patients at crisis (n = 8; median age, 37 years); and (iv) nonsevere SARS patients at crisis (n = 5, median age, 37 years). Anti-SARS spike Abs were first detected in patients at a median of 6 DSO regardless of severity. Anti-SARS spike Abs were not detected in healthy controls (data not shown). *, P < 0.05; **, P value of <0.05 in pairwise comparison to each of the other four groups.
FIG. 6.
FIG. 6.
Model of IFN signaling during the clinical evolution of SARS. The IFN signaling canonical pathway from Ingenuity Pathway Analysis software was used to model the microarray ANOVA data (mean ratios) from precrisis SARS patients (n = 14), crisis-phase SARS patients (n = 13), and SARS patients at discharge (n = 6) compared to healthy controls (10 patients), as well as the mean change (n-fold; see scale) of the same groups from the IFN-α and IFN-γ cytokine analysis. Red indicates upregulated molecules, green indicates downregulated molecules, and hatched molecules were not represented on the microarray. (A) The precrisis phase of SARS is hallmarked by robust expression of IFN-α and IFN-γ and high transcriptional activation of ISGs. (B) Despite continued upregulation of ISGs in SARS patients during crisis, TAP1, a component of the TAP heterodimer responsible for cell surface expression of MHC class I molecules, is downregulated. (C) For SARS patients that recover, TAP1 is upregulated at discharge from hospital and ISG expression has returned to healthy control levels.

References

    1. Aubert, M., and K. R. Jerome. 2003. Apoptosis prevention as a mechanism of immune evasion. Int. Rev. Immunol. 22:361-371. - PubMed
    1. Avendano, M., P. Derkach, and S. Swan. 2003. Clinical course and management of SARS in health care workers in Toronto: a case series. Can. Med. Assoc. J. 168:1649-1660. - PMC - PubMed
    1. Brierley, M. M., and E. N. Fish. 2002. IFN-alpha/beta receptor interactions to biologic outcomes: understanding the circuitry. J. Interferon Cytokine Res. 22:835-845. - PubMed
    1. Brierley, M. M., and E. N. Fish. 2005. Stats: multifaceted regulators of transcription. J. Interferon Cytokine Res. 25:733-744. - PubMed
    1. Castilletti, C., L. Bordi, E. Lalle, G. Rozera, F. Poccia, C. Agrati, I. Abbate, and M. R. Capobianchi. 2005. Coordinate induction of IFN-alpha and -gamma by SARS-CoV also in the absence of virus replication. Virology 341:163-169. - PMC - PubMed

Publication types

MeSH terms

Associated data