Comparative Study
. 2007 May 30;27(22):5936-47.
doi: 10.1523/JNEUROSCI.1040-07.2007.

Hedgehog signaling in the subventricular zone is required for both the maintenance of stem cells and the migration of newborn neurons

Affiliations
Comparative Study

Hedgehog signaling in the subventricular zone is required for both the maintenance of stem cells and the migration of newborn neurons

Francesca Balordi et al. J Neurosci. .

Abstract

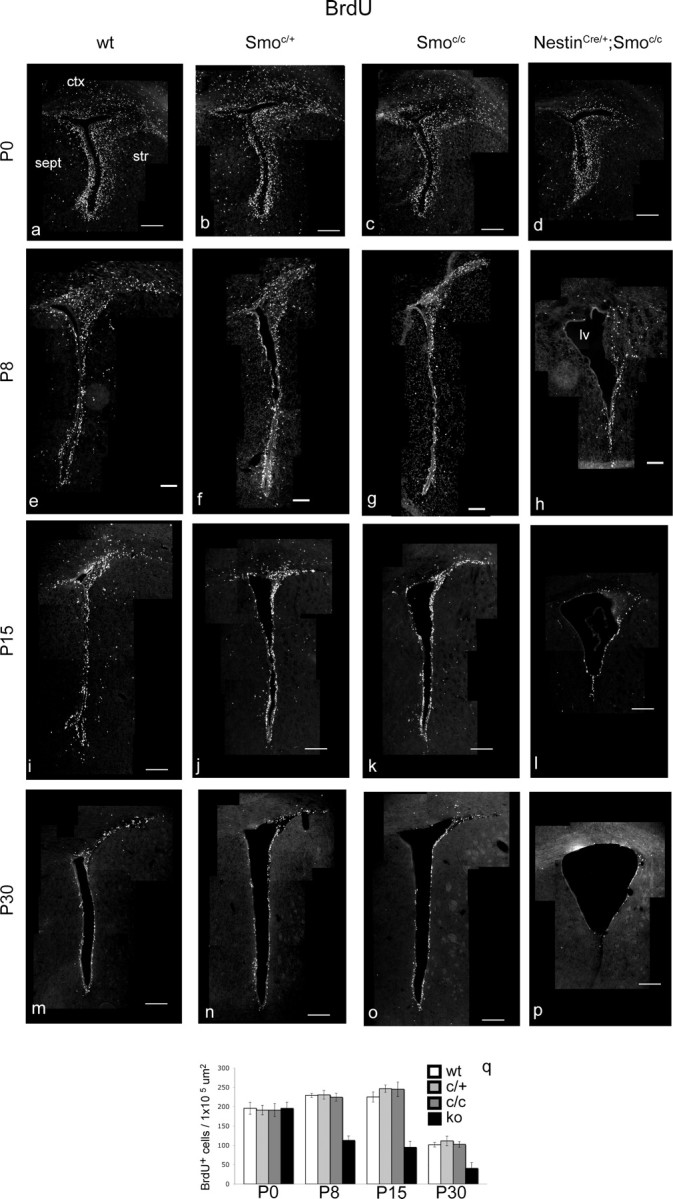
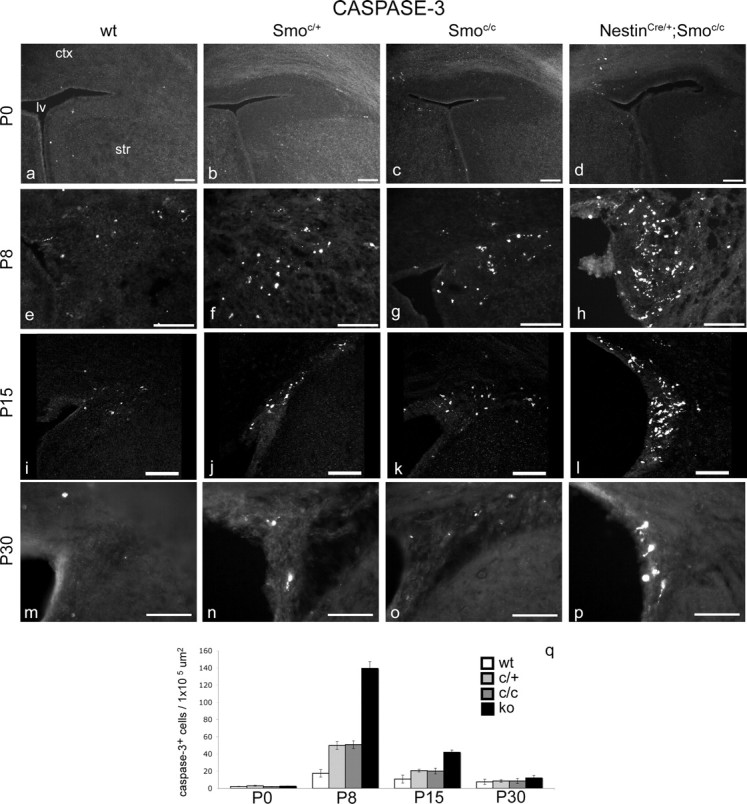
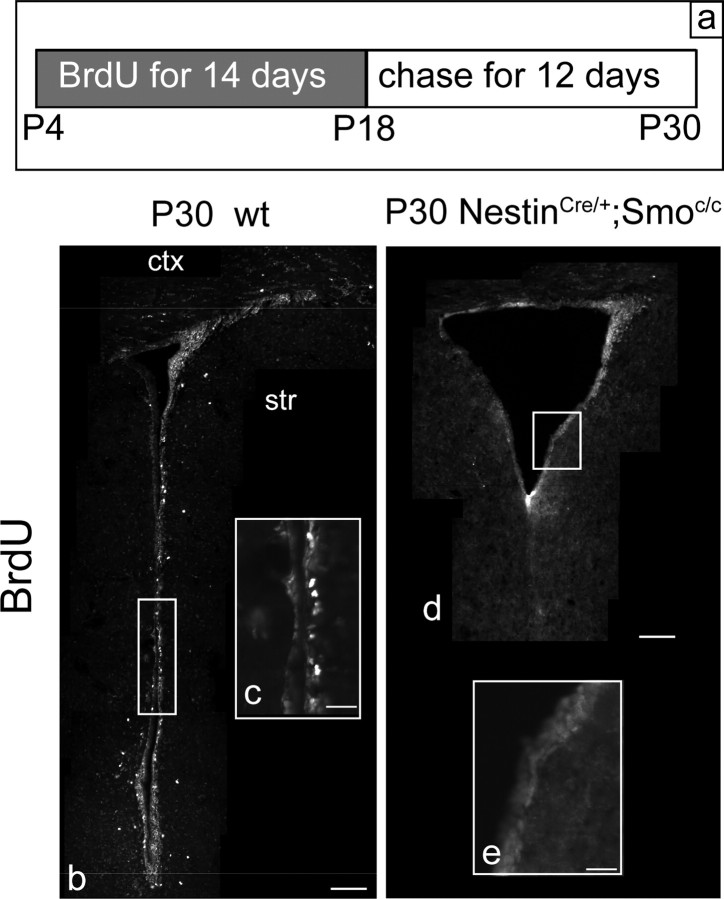
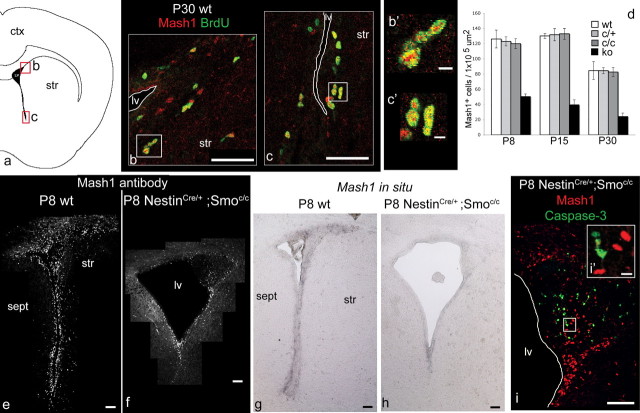
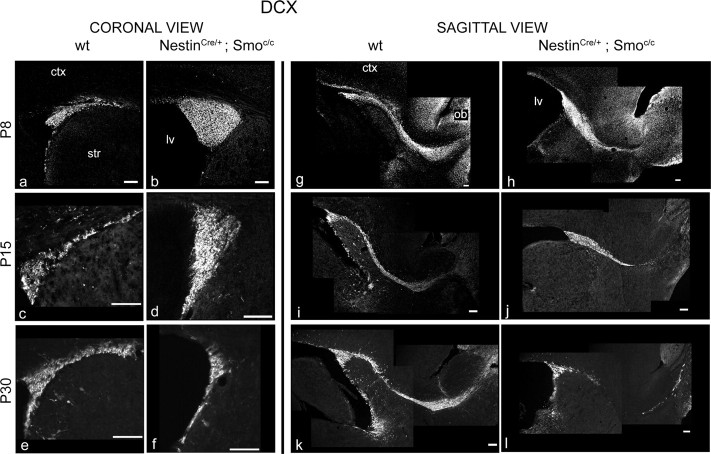
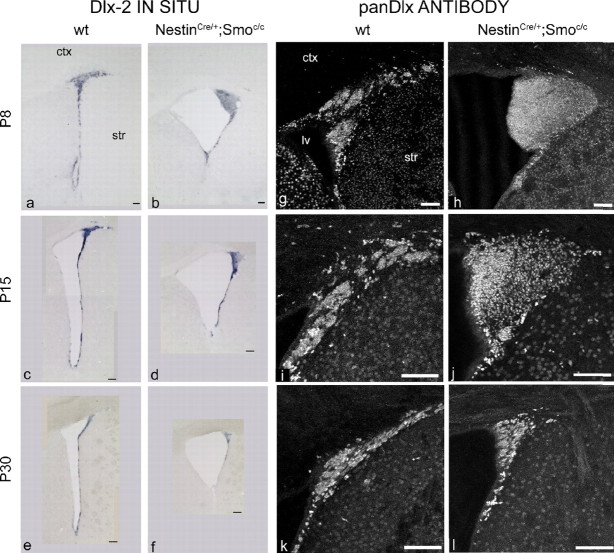
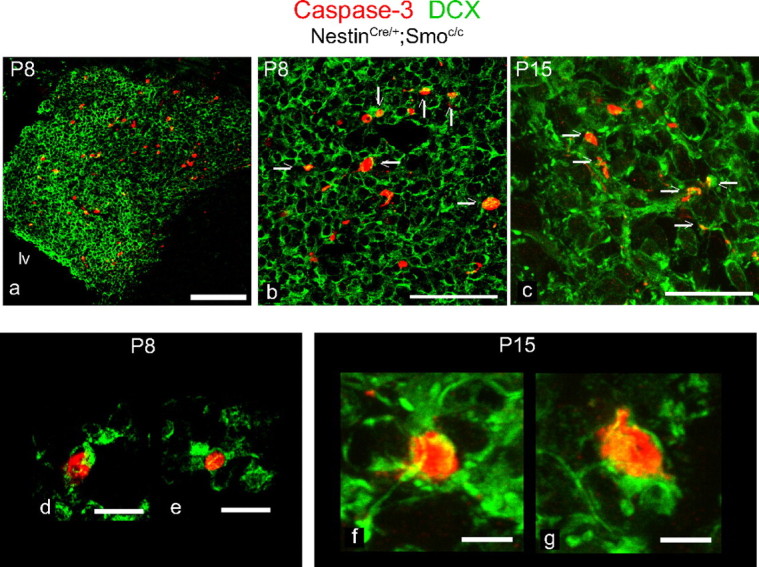
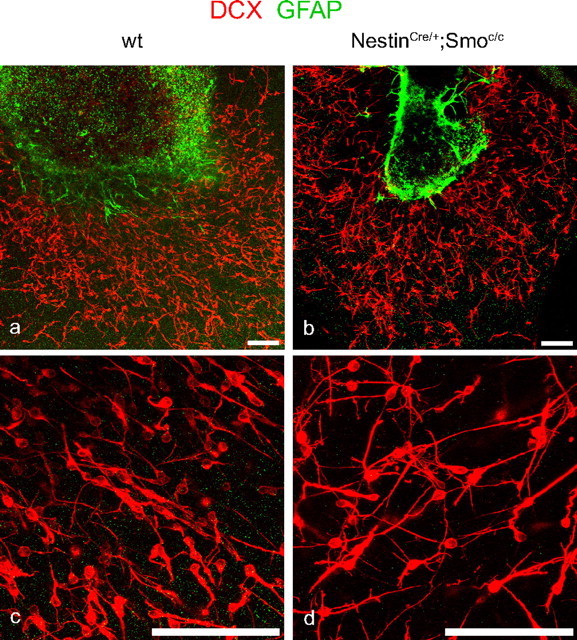
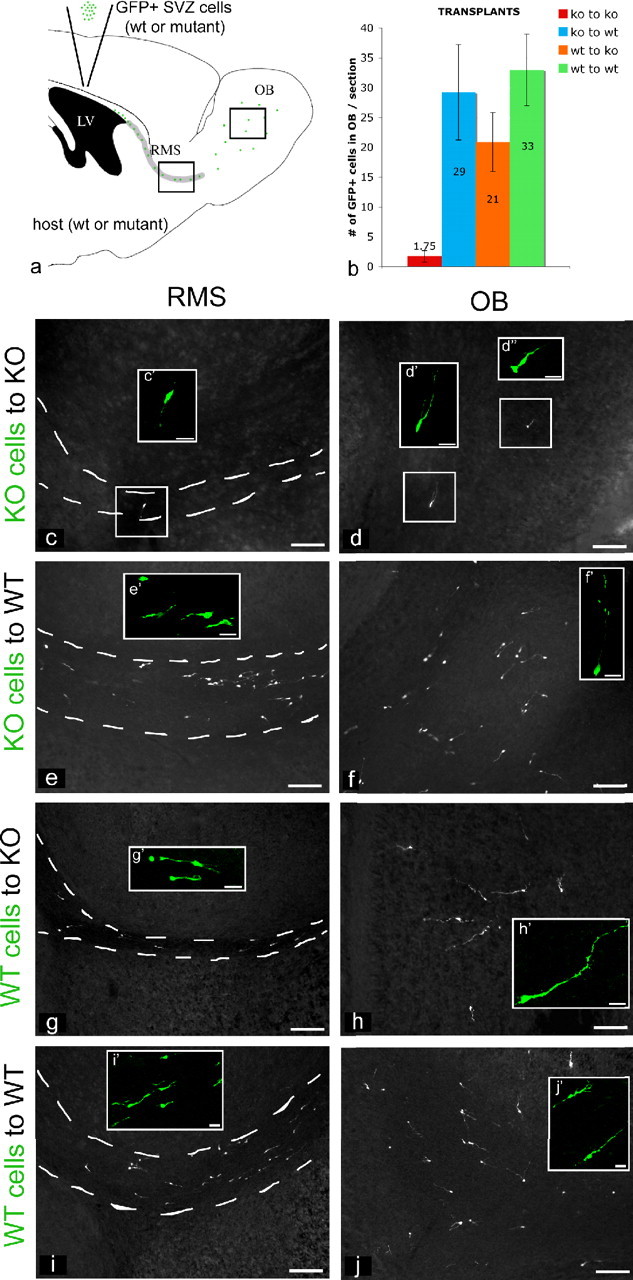
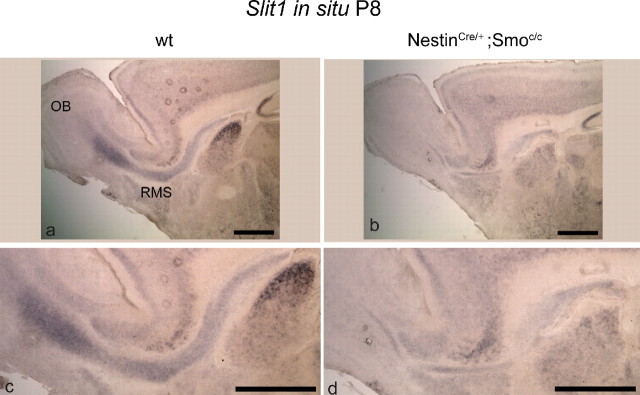
We examined the postnatal consequences of removing Hedgehog signaling within the adult stem cell niche. Although at birth the subventricular zone appears normal in mice lacking Hedgehog signaling, by postnatal day 8 it is greatly impaired, and cell death is increased. In addition, both the quiescent B stem cell population and transit-amplifying C cells become depleted postnatally. In contrast, the A cell population expands precociously, mostly fails to migrate to the olfactory bulbs, and is ultimately also depleted by postnatal day 30. In vitro and in vivo analyses demonstrate that this failure in migration is a result of nonautonomous signaling, possibly caused by a reduction in Slit1 ligand in A cells. These results suggest that Hedgehog signaling is required for the maintenance of the B and C cell populations and indirectly for the migration of the neurons that are generated from the adult stem cell niche.


Figures

Figure 1.
Figure 1.
The general level of proliferation is strongly reduced in the SVZ of perinatal conditional Smoothened-null mice from P8 onward. a–p, Coronal views of the whole SVZ showing BrdU-incorporating cells in wild-type (a, e, i, m), Smoc/+ (b, f, j, n), Smoc/c (c, g, k, o), and NestinCre/+;Smoc/c (d, h, l, p) animals at P0 (ad), P8 (eh), P15 (il), and P30 (m–p). q, Data are quantitated. ctx, Cortex; str, striatum; sept, septum; lv, lateral ventricle; ko, knock-out. Scale bars: e–h, 100 μm; a–d, i–p, 200 μm. Error bars represent SD. Statistics were performed by ANOVA; at P0, p = 0.94; at other ages, p < 0.0001.
Figure 2.
Figure 2.
Cell death is detected in the SVZ of perinatal conditional Smoothened-null mice from P8 onward. Mice carrying one or two copies of the Smoc allele show an intermediate level of cell death between that observed in wild-type mice and NestinCre/+;Smoc/c mutants. a–p, Coronal views of the striatocortical angle of the SVZ showing cleaved-caspase-3 immunocytochemical staining in wild-type (a, e, i, m), Smoc/+ (b, f, j, n), Smoc/c (c, g, k, o), and NestinCre/+;Smoc/c (d, h, l, p) animals at P0 (a–d), P8 (e–h), P15 (i–l), and P30 (m–p). q, Data are quantitated. ctx, Cortex; str, striatum; lv, lateral ventricle; ko, knock-out. Scale bars, 100 μm. Error bars represent SD. Statistics were performed by ANOVA; at P30, p = 0.0002; at other ages, p < 0.0001.
Figure 3.
Figure 3.
By P30, slow-dividing B cells are absent in conditional Smoothened-null mice. a, The diagram shows the protocol used for marking quiescent B cells at P30. b–e, BrdU-incorporating cells in the SVZ of wild-type (b, c) and NestinCre/+;Smoc/c (d, e) animals at P30. b, d, Coronal views of the whole SVZ. c, e, Enlargements from the appropriate areas shown in b and d, respectively. ctx, Cortex; str, striatum. Scale bars: b, d, 100 μm; c, e, 20 μm.
Figure 4.
Figure 4.
C cells are decreased by P8 onward in conditional Smoothened-null mice, but this reduction is not the result of apoptosis within C cells. a, Schematic of the lateral ventricle and SVZ, showing the two areas corresponding to b and c. b, c, Double labeling for BrdU (in green) and Mash1 (in red) in P30 wild-type mice after one intraperitoneal injection of BrdU 1 h before the mice were killed. b′, c′, Enlargements from the appropriate areas shown in b and c, respectively. d, Data in e and f, together with other ages (P15 and P30) and additional controls (Smoc/+ and Smoc/c) (shown in supplemental Fig. S5, available at www.jneurosci.org as supplemental material) are quantitated. e–h, Coronal views of the whole SVZ showing Mash1 immunocytochemical staining (e, f) and in situ hybridization for Mash1 expression (g, h) in wild-type (e, g) and NestinCre/+;Smoc/c (f, h) animals at P8. i, Coronal view of the striatocortical angle of the SVZ showing double labeling for caspase-3 (in green) and Mash1 (in red) in P8 NestinCre/+;Smoc/ mice; there is no colabeling between those markers. i′, Enlargement from the appropriate area shown in i. ctx, Cortex; str, striatum; sept, septum; lv, lateral ventricle; ko, knock-out. Scale bars: b, c, 50 μm; b′, c′, 5 μm; e–i, 100 μm; i′, 10 μm. Error bars represent SD. Statistics were performed by ANOVA; at all ages, p is <0.0001.
Figure 5.
Figure 5.
A cells are expanded at P8 but decreased at P30 in conditional Smoothened-null mice. a–l, Doublecortin immunocytochemical staining in the SVZ of wild-type (a, c, e, g, i, k) and NestinCre/+;Smoc/c (b, d, f, h, j, l) animals at P8 (a, b, g, h), P15 (c, d, i, j), and P30 (e, f, k, l). a–f, Coronal views of the striatocortical angle of the SVZ. g–l, Sagittal views of the SVZ and RMS. ctx, Cortex; str, striatum; lv, lateral ventricle. Scale bars, 100 μm.
Figure 6.
Figure 6.
The pool of Dlx+ cells is expanded at P8 but reduced by P30 in conditional Smoothened-null mice. a–f, Coronal views of the whole SVZ showing in situ hybridization for Dlx-2 expression in wild-type (a, c, e) and NestinCre/+;Smoc/c (b, d, f) animals at P8 (a, b), P15 (c, d), and P30 (e, f). g–l, Coronal views of the striatocortical angle of the SVZ showing pan-Dlx immunocytochemical staining in wild-type (g, i, k) and NestinCre/+;Smoc/c (h, j, l) animals at P8 (g, h), P15 (i, j), and P30 (k, l). ctx, Cortex; str, striatum; lv, lateral ventricle. Scale bars, 100 μm.
Figure 7.
Figure 7.
A cells undergo apoptosis in conditional Smoothened-null mice. a–g, Coronal views of the striatocortical angle of the SVZ in NestinCre/+;Smoc/c animals at P8 (a, b, d, e) and P15 (c, f, g) immunostained for DCX (in green) and caspase-3 (in red): arrows indicate colabeling between those markers. d–f, High-magnification shots of individual cells that show colabeling. lv, Lateral ventricle. Scale bars: a, 100 μm; b, c, 50 μm; d, e, 10 μm; f, g, 5 μm.
Figure 8.
Figure 8.
A cells lacking Hh signaling migrate normally in vitro. a–d, Double labeling for DCX (in red) and GFAP (in green) of SVZ explants grown in Matrigel coming from wild-type (a, c) and NestinCre/+;Smoc/c (b, d) animals at P8. c, d, Enlargements of a and b, respectively. Scale bars, 100 μm.
Figure 9.
Figure 9.
Hedgehog signaling is nonautonomously required for the migration of A cells. a, The diagram shows the protocol used for transplants: we dissected and dissociated SVZ cells from either perinatal (P8) mutant or wt mice, carrying the β-actinEGFP/+ allele, and reciprocally transplanted these GFP-labeled cells into the SVZ of mutant or wt animals. We analyzed mice that received transplants 1 week later, at P15. b, Quantitation of the four types of transplants performed: SVZ cells from NestinCre/+;Smoc/c;β-actinEGFP/+ animals were homotopically injected in NestinCre/+;Smoc/c animals (c, d); SVZ cells from NestinCre/+;Smoc/c;β-actinEGFP/+ animals were injected into the SVZ of wt animals (e, f); SVZ cells from β-actinEGFP/+ animals were homotopically injected in NestinCre/+;Smoc/c animals (g, h); and SVZ cells from β-actinEGFP/+ animals were injected into the SVZ of wt animals (i, j). c–j, Sagittal views of the RMS (c, e, g, i) and OB (d, f, h, j) of P15 transplanted mice showing immunocytochemical staining for GFP. c′, d′, d″, e′, f′, g′, h′, i′, j′, Examples of migrating neuroblasts in the RMS (c′, e′, g′, i′) and interneurons in the granule layer of the OB (d′, d″, f′, h′, j′). LV, Lateral ventricle; ko, knock-out. Scale bars: c–j, 100 μm; c′, d′, d″, e′, f′, g′, h′, i′, j′, 20 μm. Error bars represent SD. Statistics were performed by ANOVA; p = 0.011.
Figure 10.
Figure 10.
Slit1 expression is markedly decreased in the SVZ and RMS of conditional Smoothened-null mice at P8. a–f, Sagittal views of SVZ, RMS, and OB showing in situ hybridization for Slit1 expression in wild-type (a, c) and NestinCre/+;Smoc/c animals (b, d) at P8. Scale bars, 200 μm.

References

    1. Ahn S, Joyner AL. In vivo analysis of quiescent adult neural stem cells responding to Sonic hedgehog. Nature. 2005;437:894–897. - PubMed
    1. Anthony TE, Klein C, Fishell G, Heintz N. Radial glia serve as neuronal progenitors in all regions of the central nervous system. Neuron. 2004;41:881–890. - PubMed
    1. Bai CB, Auerbach W, Lee JS, Stephen D, Joyner AL. Gli2, but not Gli1, is required for initial Shh signaling and ectopic activation of the Shh pathway. Development. 2002;129:4753–4761. - PubMed
    1. Bai CB, Stephen D, Joyner AL. All mouse ventral spinal cord patterning by hedgehog is Gli dependent and involves an activator function of Gli3. Dev Cell. 2004;6:103–115. - PubMed
    1. Blaess S, Corrales JD, Joyner AL. Sonic hedgehog regulates Gli activator and repressor functions with spatial and temporal precision in the mid/hindbrain region. Development. 2006;133:1799–1809. - PubMed

Publication types

Substances