Comparative Study
. 2007 May 30;27(22):6006-18.
doi: 10.1523/JNEUROSCI.0176-07.2007.

Glial-cytokine-neuronal interactions underlying the mechanisms of persistent pain

Affiliations
Comparative Study

Glial-cytokine-neuronal interactions underlying the mechanisms of persistent pain

Wei Guo et al. J Neurosci. .

Abstract

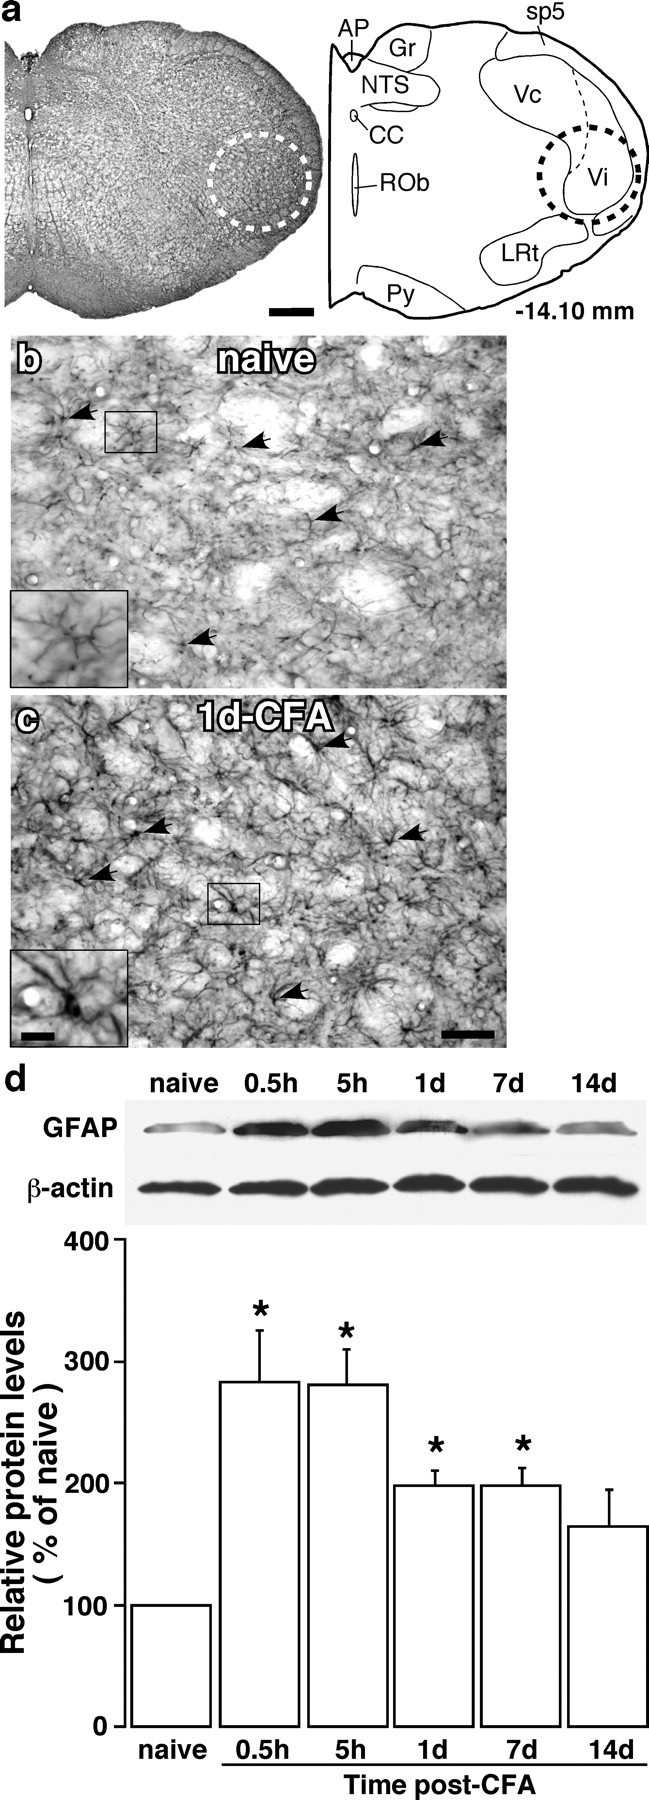
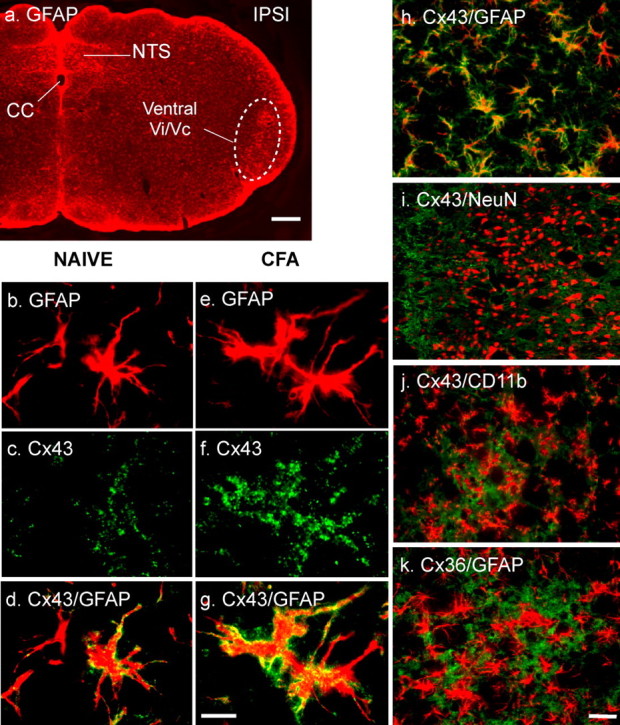
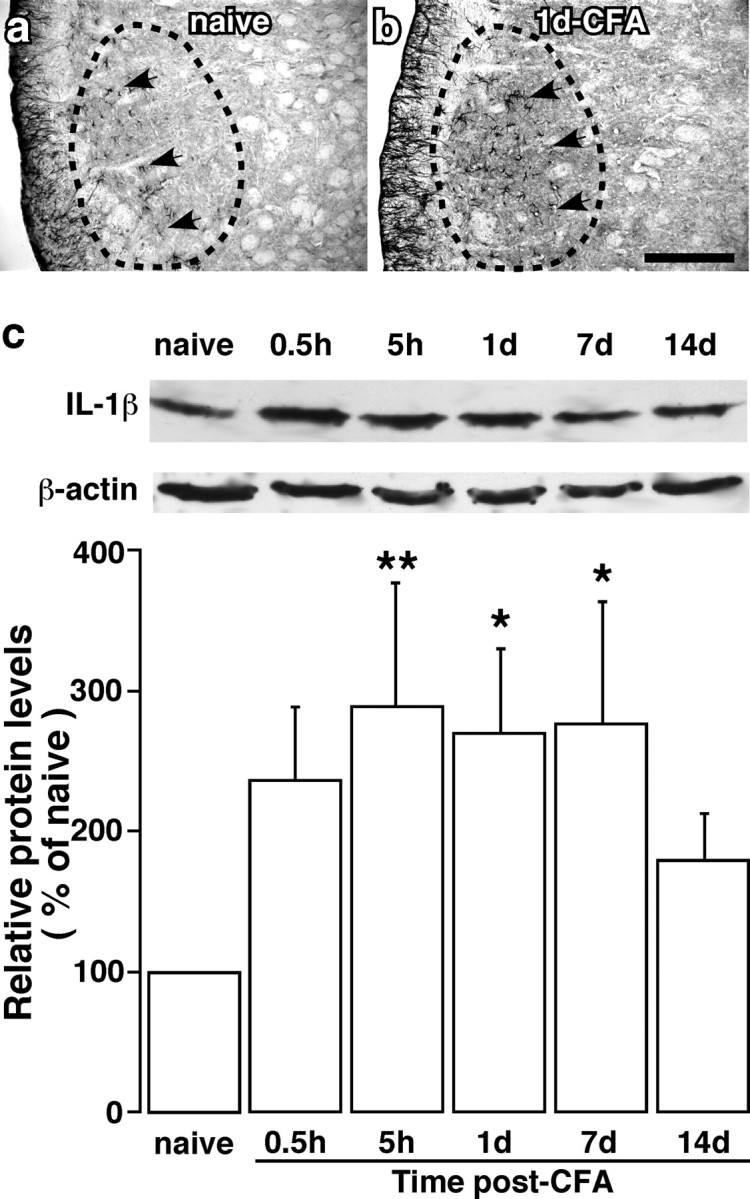
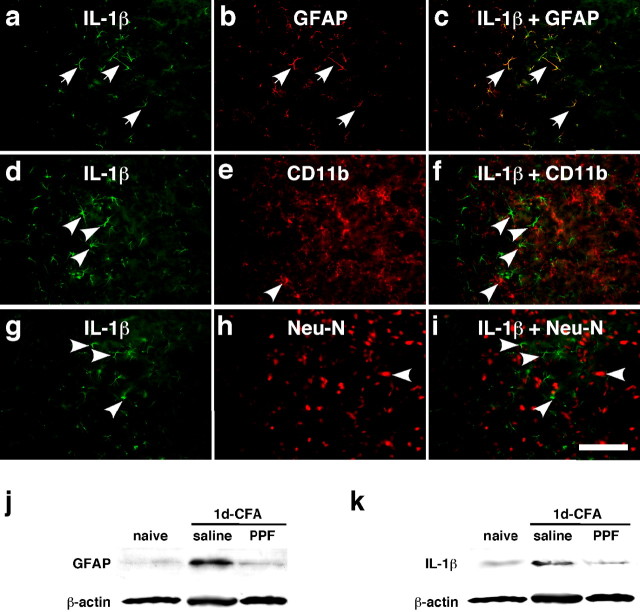
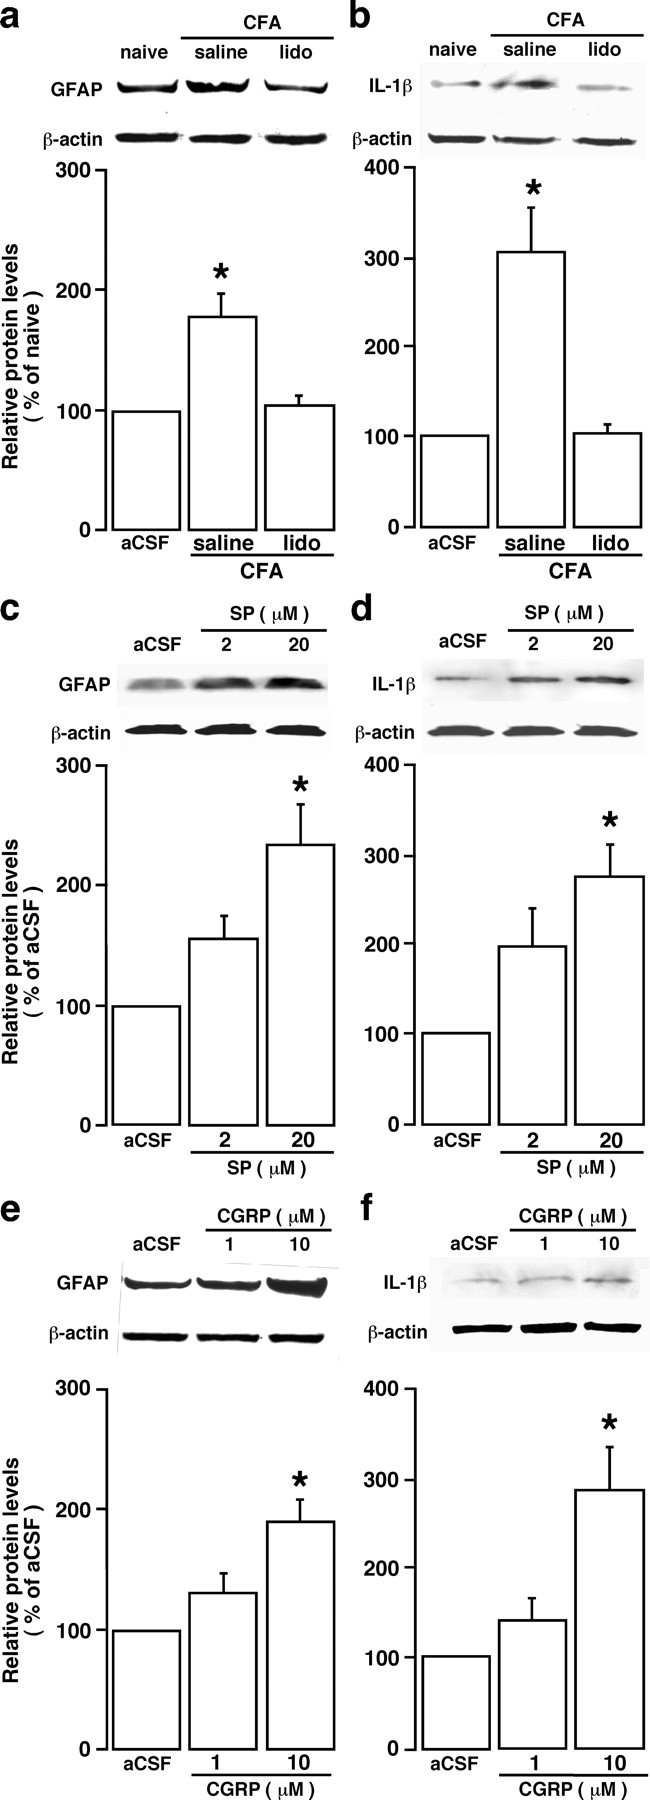
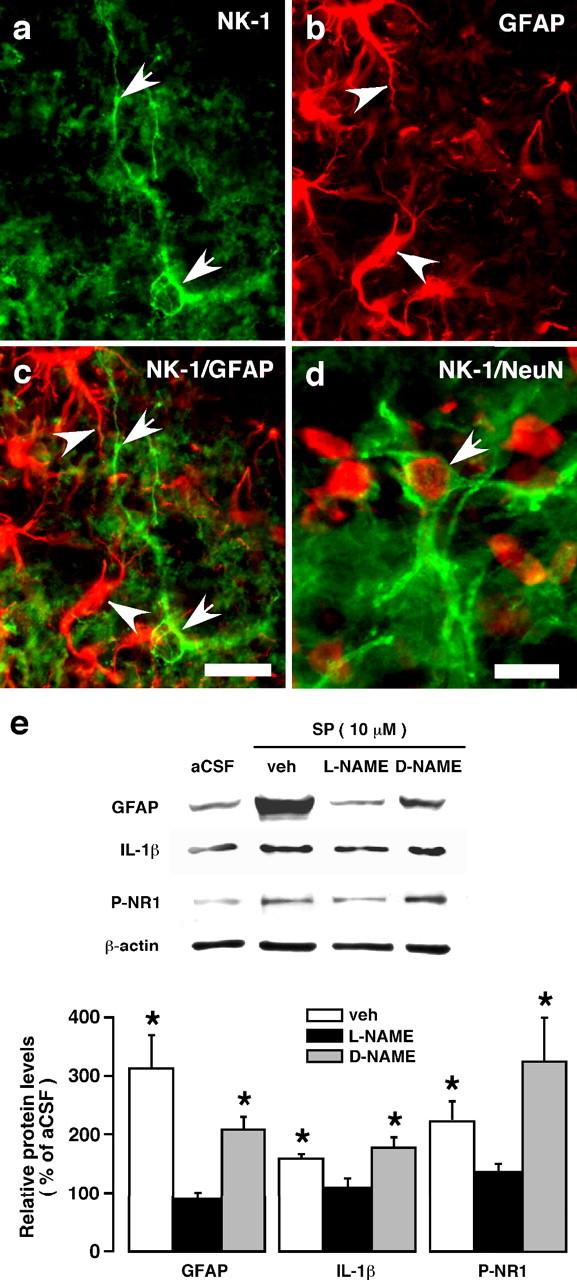
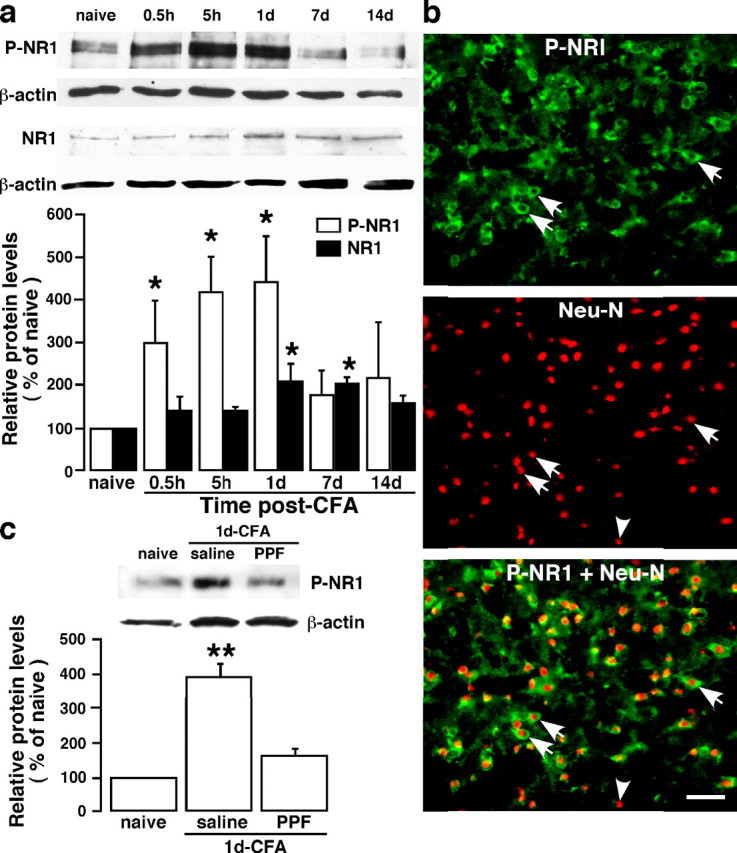
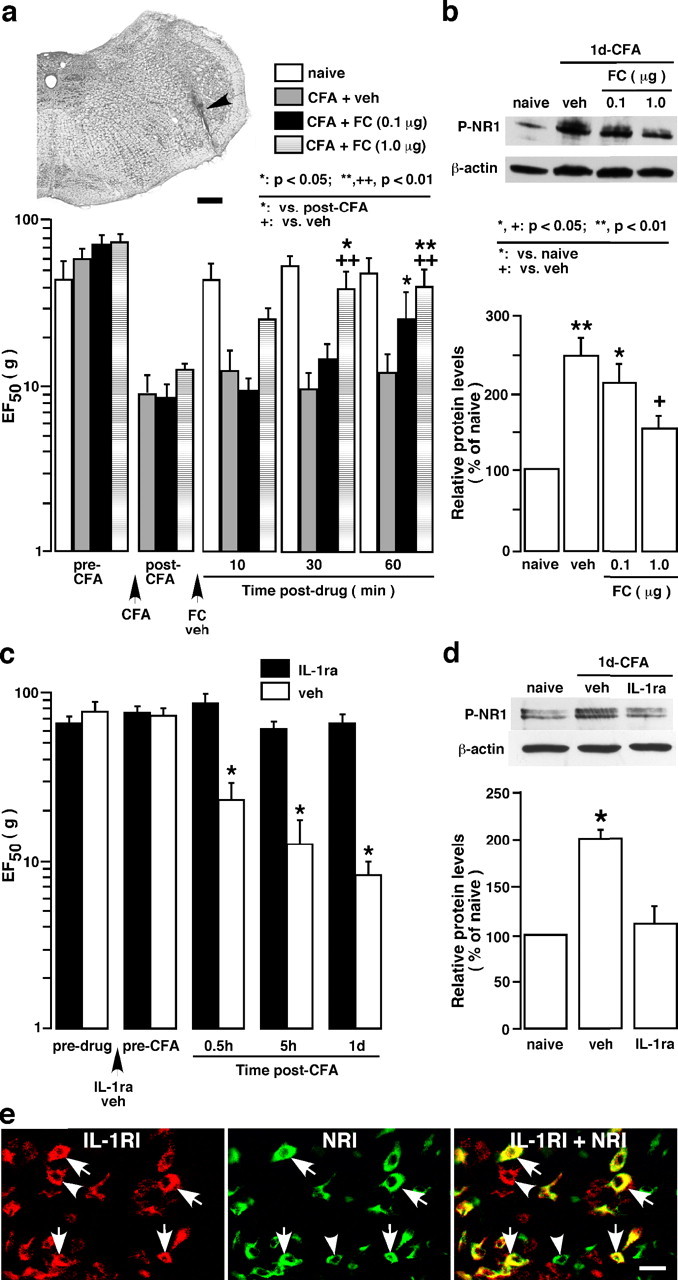
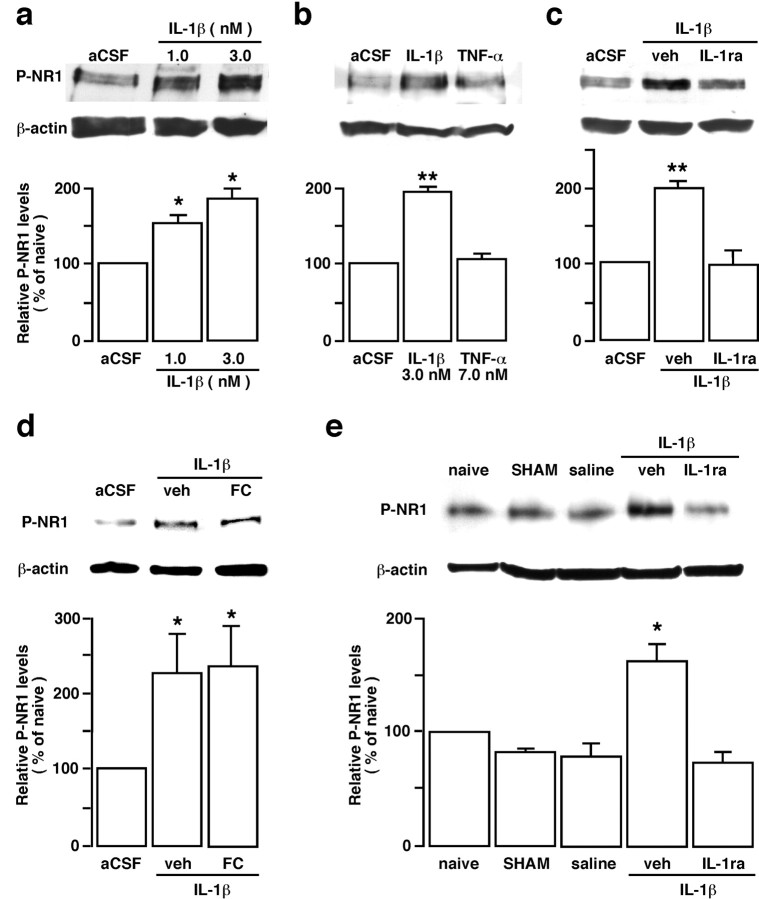
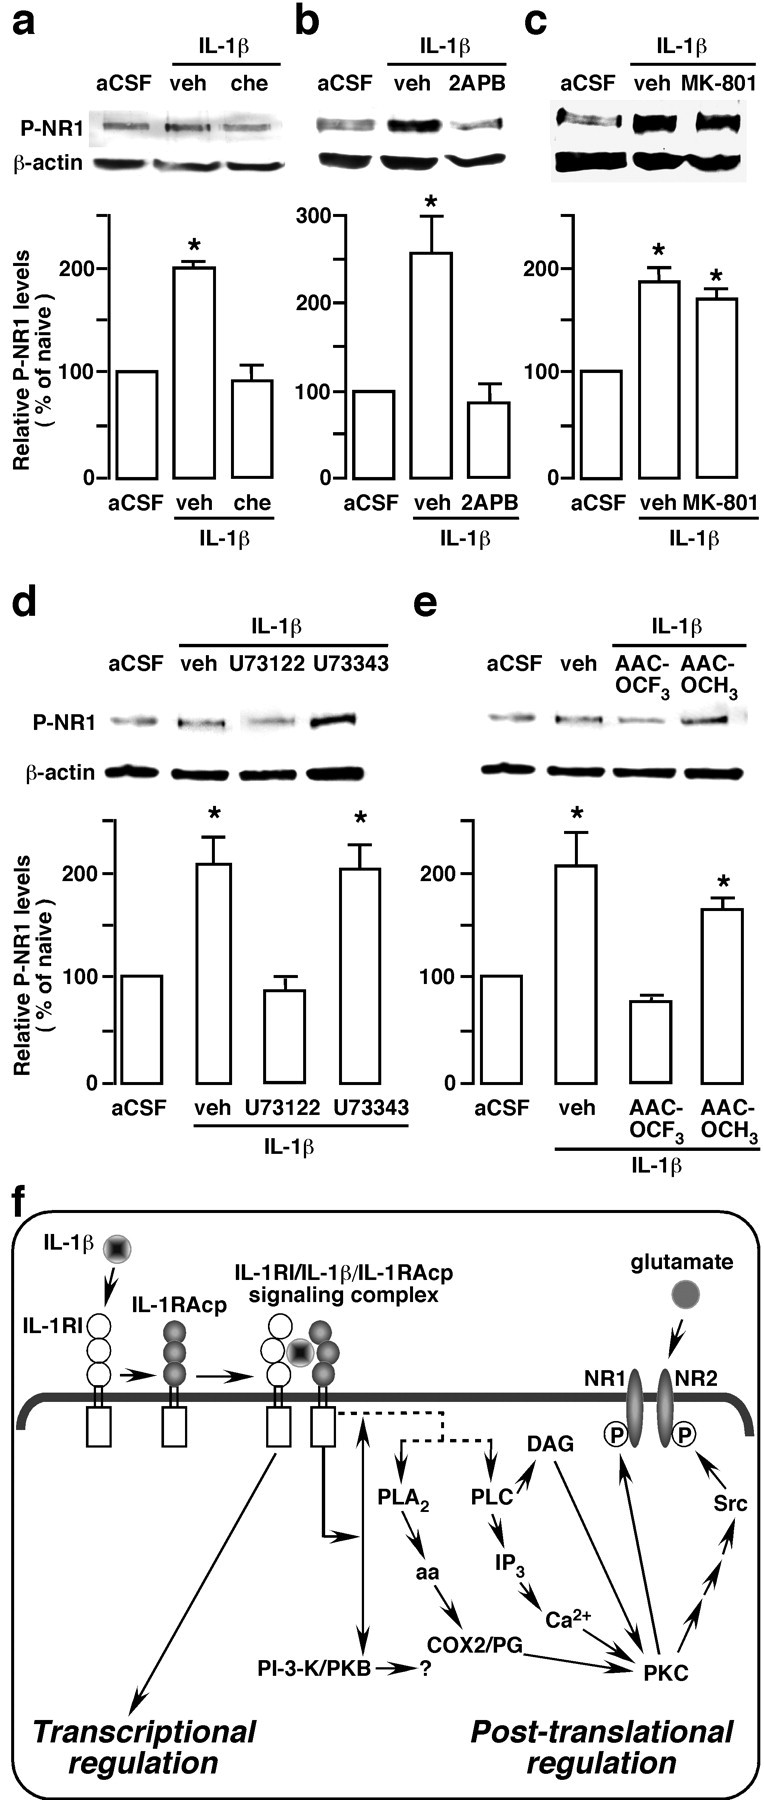
The emerging literature implicates a role for glia/cytokines in persistent pain. However, the mechanisms by which these non-neural elements contribute to CNS activity-dependent plasticity and pain are unclear. Using a trigeminal model of inflammatory hyperalgesia, here we provide evidence that demonstrates a mechanism by which glia interact with neurons, leading to activity-dependent plasticity and hyperalgesia. In response to masseter inflammation, there was an upregulation of glial fibrillary acidic proteins (GFAPs), a marker of astroglia, and interleukin-1beta (IL-1beta), a prototype proinflammatory cytokine, in the region of the trigeminal nucleus specifically related to the processing of deep orofacial input. The activated astroglia exhibited hypertrophy and an increased level of connexin 43, an astroglial gap junction protein. The upregulated IL-1beta was selectively localized to astrocytes but not to microglia and neurons. Local anesthesia of the masseter nerve prevented the increase in GFAP and IL-1beta after inflammation, and substance P, a prototype neurotransmitter of primary afferents, induced similar increases in GFAP and IL-1beta, which was blocked by a nitric oxide synthase inhibitor N(G)-nitro-L-arginine methyl ester. Injection of IL-1 receptor antagonist and fluorocitrate, a glial inhibitor, attenuated hyperalgesia and NMDA receptor phosphorylation after inflammation. In vitro application of IL-1beta induced NR1 phosphorylation, which was blocked by an IL-1 receptor antagonist, a PKC inhibitor (chelerythrine), an IP3 receptor inhibitor (2-aminoethoxydiphenylborate), and inhibitors of phospholipase C [1-[6-((17b-3-methoxyestra-1,3,5(10)-trien-17-yl)amino)hexyl]-1H-pyrrole-2,5-dione] and phospholipase A2 (arachidonyltrifluoromethyl ketone). These findings provide evidence of astroglial activation by tissue injury, concomitant IL-1beta induction, and the coupling of NMDA receptor phosphorylation through IL-1 receptor signaling.


Figures

Figure 1.
Figure 1.
Upregulation of GFAP in astroglia after inflammation. a, Brainstem section (left) and its drawing (right) at a level ∼14.1 mm posterior to bregma illustrates the area analyzed (dashed circles) in the present study, which included the ventral portion of the Vi/Vc transition zone. AP, Area postrema; cc, central canal; Gr, gracile nucleus; LRt, lateral reticular nucleus; NTS, nucleus tractus solitarius; Py, pyramidal tract; Rob, nucleus raphe obscurus; sp5, spinal trigeminal tract. Scale bar, 0.4 mm. b, c, GFAP-like immunostaining in the ventral Vi/Vc transition zone in noninflamed (b; naive) and CFA-inflamed (c; 1 d post-CFA) rats. The insets (scale bar, 0.025 mm) at the bottom left corners were enlarged from small rectangles in b and c, respectively. Note the hypertrophy of astroglia in the inflamed rat (arrows, insets) compared with the naive rat. Scale bar, 0.1 mm. d, Western immunoblot illustrating masseter inflammation-induced increase in GFAP. The ventral portion of the Vi/Vc was punched out at various time points and total proteins were isolated. β-Actin was used as a loading control. An example of the blot is shown (top), and the relative protein levels are shown in the bottom histogram. *p < 0.05 vs naive rats. n = 4 for each time point. Error bars represent SEM.
Figure 2.
Figure 2.
Connexin 43 (Cx43) is increased in reactive astrocytes in Vi/Vc after masseter inflammation. a, Immunofluorescent labeling of GFAP. An area of ventral Vi/Vc (dashed circle) is enlarged in e–k. cc, Central canal; NTS, nucleus tractus solitarius; IPSI, ipsilateral. b–g, Compared with the naive rat (b–d), CFA- (1 d; e–g) induced hypertrophy of astrocytes (b, e) and an increased staining intensity for Cx43 (c, f). d and g show double labeling of Cx43 with GFAP (yellow-orange). h–j, Double immunofluorescence labeling with antibodies against Cx43 (green) and GFAP (h; red), NeuN (i; red, neuronal marker), or CD11b (j; red, microglial marker). k, Immunofluorescence labeling of Cx36 (red, neuronal gap junction protein) with GFAP. Note the presence of overlapped staining in h (yellow-orange) and lack of overlap in staining in i–k, indicating that Cx43 is an astrocytic gap junction protein. Scale bars: a, 0.2 mm; b–k, 0.02 mm.
Figure 3.
Figure 3.
Masseter inflammation induced increases in IL-1β immunoreactivity in the Vi/Vc trigeminal transition zone. a, b, IL-1β-like immunostaining in the ventral Vi/Vc transition zone in noninflamed (a; naive) and CFA-inflamed (b; 1 d post-CFA) rats. The dashed circles indicate regions of the Vi/Vc transition zone. Arrows indicate examples of IL-1β-labeled profiles. Scale bar, 0.2 mm. c, Western immunoblot illustrating masseter inflammation-induced increase in IL-1β. An example of the blot is shown (top), and the relative protein levels are shown in the bottom histogram. *p < 0.05; **p < 0.01 vs naive rats. n = 4 for each time point. Error bars represent SEM.
Figure 4.
Figure 4.
Colocalization of IL-1β with GFAP and the effect of a glial inhibitor on GFAP and IL-1β upregulation. a–i, Brainstem tissue sections were processed for IL-1β (a, d, g) and double labeled with GFAP (b), CD11b (e), or NeuN (h) 1 d after masseter inflammation. Photomicrograph images are from the ventral portion of the Vi/Vc transition zone. IL-1β immunoreactivity is shown as green fluorescence after reacting with anti-goat IgG conjugated with Cy2. GFAP-, CD11b-, and NeuN-LI are visualized with Cy3 conjugated with anti-rabbit IgG (red). Overlap of a and b reveals double fluorescence (c; yellow/orange), which was only identified for IL-1β and GFAP staining (arrows in a, b, c), indicating the selective induction of IL-1β in astroglia. d–f and g–i show lack of double labeling of IL-1β with CD11b, a marker of microglia, or NeuN, a marker of neurons. The single-labeled neurons in d–i are indicated by arrowheads. Scale bar, 0.1 mm. j, k, Western blots illustrating the effect of propentofylline (PPF), a glial inhibitor, on masseter inflammation-induced increase in GFAP (j) and IL-1β (k) in the ventral Vi/Vc transition zone. Propentofylline was injected intraperitoneally at 10 mg/kg first at 20 min before CFA, and the second PPF injection (10 mg/kg) was given 8 h after CFA. The Vi/Vc tissues were collected 1 d after CFA injection. Saline was injected as a vehicle control. Compared with naive rats, the GFAP and IL-1β immunoreactivity was increased at 1 d in rats receiving saline. The PPF treatment significantly attenuated CFA-induced increase in GFAP and IL-1β (p < 0.01; n = 3 per group.)
Figure 5.
Figure 5.
Neuronal signal contributes to inflammation-induced glial activation. a, b, The effect of local anesthesia on inflammation-induced astroglial activation. Lidocaine (lido; 0.05 ml, 2%) was infiltrated to the tissues surrounding the masseter nerve 10 min before CFA injection, and the Vi/Vc tissues were removed 30 min after CFA injection. Saline (0.05 ml, 0.9%) was injected as a control for lidocaine. Compared with saline-injected rats, the increase in GFAP (a) and IL-1β (b) was blocked by lidocaine treatment, suggesting that inflammation-induced astrocytic activation depended on the input from the injured site. c, d, Substance P (SP), a prototype neurotransmitter released from central terminals of primary afferent neurons, induced increases in GFAP (c) and IL-1β (d) levels in the Vi/Vc transition zone. Transverse medullary slices (0.5 mm thick) including the Vi/Vc were obtained from 8- to 10-week-old rats. The slice was incubated in artificial CSF (aCSF) with SP (2 and 20 μm) for 20 min and proteins in the ventral Vi/Vc extracted for Western blot analysis. e, f, CGRP induces GFAP and IL-1β in the Vi/Vc transition zone in vitro. Transverse medullary slices (0.5 mm thick) including the Vi/Vc were incubated in aCSF with CGRP (1 and 10 μm) for 20 min and proteins in the ventral Vi/Vc extracted for Western blot analysis. CGRP induced increases in GFAP (e) and IL-1β (f) levels in the Vi/Vc transition zone. For all panels, representative immunoblots against anti-GFAP and IL-1β antibodies are shown on top and the relative protein levels are shown in the bottom histogram. *p < 0.05 vs naive (a, b) rats or aCSF (c–f). n = 3–4 for each time point. Error bars represent SEM.
Figure 6.
Figure 6.
Lack of NK-1 (neurokinin-1) tachykinin receptor immunoreactivity in Vi/Vc astrocytes and the effect of a nitric oxide synthase inhibitor on substance P-induced upregulation of GFAP, IL-1β, and NMDAR phosphorylation (P-NR1) in vitro. a, NK-1-like immunoreactivity is shown by green immunofluorescence (Alexa Fluor 488, 1:500). Arrows indicate NK-1 staining profiles. b, The same field as panel a was stained with GFAP (red, Cy3; 1:500), a marker of astrocytes. Arrowheads indicate examples of GFAP staining profile. c, Overlap of panels a and b shows a lack of colocalization of GFAP (arrowheads) and NK-1 (arrows) immunoreactivity. d, Arrow indicates double label of NK-1 and NeuN, confirming neuronal localization of NK-1. Images represent a field of the trigeminal Vi/Vc transition zone from an adult rat at 24 h after masseter inflammation. Scale bars: a–c, 0.02 mm; d, 0.01 mm. e, Effect of a nitric oxide synthase inhibitor, l-NAME, on substance P-induced upregulation of GFAP, IL-1β, and NMDAR phosphorylation (P-NR1). Medullary slices were incubated with l-NAME (2 mm), d-NAME (2 mm, inactive isoform of l-NAME), or vehicle (saline) before incubation with substance P (10 μm). Representative immunoblots are shown on top, and the relative protein levels are shown in the bottom histogram. *p < 0.05 vs l-NAME. n = 3–4 per group. Error bars represent SEM.
Figure 7.
Figure 7.
Inflammation-induced NMDA receptor phosphorylation and the effect of a glial inhibitor. a, Masseter inflammation induced a time-dependent increase in phosphoserine 896 NR1 (P-NR1) in the Vi/Vc. A late (1–7 d after CFA injection) and slight increase in the NR1 protein levels was also seen. Representative immunoblots against anti-P-NR1 and anti-NR1 antibodies are shown on top and the relative P-NR1 and NR1 levels are shown below. *p < 0.05 versus naive. n = 4 per time point. b, Localization of P-NR1 in Vi/Vc neurons 1 d after CFA injection. P-NR1 is shown as green fluorescence (Alexa Fluor 488; top). NeuN is visualized with Cy3 (red; middle). Overlap of left and middle panels reveals cells that exhibit double fluorescence of NeuN (nucleus) and P-NR1 (cytoplasm) in the same neurons (bottom). Examples of double- (arrows) and single- (arrowheads) labeled neurons are indicated. Scale bar, 0.05 mm. c, The effect of PPF on masseter inflammation-induced increase in P-NR1. Propentofylline (10 mg/kg, i.p.) was first injected 20 min before CFA, and the second PPF injection (10 mg/kg) was given 8 h after CFA injection. The Vi/Vc tissues were collected at 1 d after CFA. Saline was injected as a vehicle control for PPF. Compared with noninflamed rats (naive), the P-NR1 immunoreactivity was increased 1 d in rats receiving saline. The PPF treatment attenuated CFA-induced increase in P-NR1 (PPF). **p < 0.01 versus naive. n = 4 per group. Error bars represent SEM.
Figure 8.
Figure 8.
Effect of glial inhibitor fluorocitrate (FC) and IL-1ra on behavioral hyperalgesia and NMDAR phosphorylation after masseter inflammation. a, Effect of microinjection of FC into the Vi/Vc transition zone on hyperalgesia. The top image shows an example of the injection site (arrow). Scale bar, 0.4 mm. The bottom histogram shows EF50 values derived from stimulus–response curves in behavioral testing. Vertical bars indicate 95% confidence intervals of EF50. A significant decrease in EF50 indicates the presence of hyperalgesia and allodynia. Intra-Vi/Vc injection of fluorocitrate (0.1 and 1.0 μg; n = 6 per dose) attenuated the masseter hyperalgesia, as indicated by a significant increase in EF50 values. b, Rats in a were killed 70 min after drug injection, and the ventral Vi/Vc tissues were punched out for Western blotting. Fluorocitrate attenuated inflammation- induced increase in P-NR1 levels. c, Effect of IL-1ra on hyperalgesia. Compared with vehicle-injected rats, intrathecal infusion of IL-1ra (12.5 pg per 500 nl/h; n = 9) attenuated the masseter hyperalgesia. Asterisks denote significant differences from the vehicle saline- (veh; n = 6) treated rats (*p < 0.05; ANOVA with repeated-measures and post hoc tests). The infusion of the drug started 3 d before CFA injection. d, Rats in c were killed 1 d after inflammation and the ventral Vi/Vc tissues were punched out for the Western blot. Compared with vehicle-treated rats, IL-1ra attenuated inflammation-induced increase in P-NR1 levels. *p < 0.05 versus naive rats. e, Colocalization of IL-1R with NR1 in Vi/Vc neurons. IL-1R is shown as red fluorescence (Cy3, left). NR1 is visualized with Cy2 (green, middle). Overlap of left and middle panels reveals cells that exhibit double fluorescence (yellow/orange), suggesting colocalization of IL-1R and NR1. Examples of double- (arrows) and single- (arrowheads) labeled neurons are indicated. Scale bar, 0.02 mm. Error bars in a–d represent SEM.
Figure 9.
Figure 9.
IL-1β induces NMDA receptor NR1 ser896-phosphorylation. Representative immunoblots are shown on top, and mean relative levels of P-NR1 proteins are shown in the bar graphs. a–d, The transverse medullary slices, including the Vi/Vc transition zone, were obtained from adult 8- to 10-week-old rats. The slices were incubated with IL-1β or TNF-α for 15 min, and the ventral Vi/Vc tissues were harvested by taking punches. Note that IL-1β induced a significant increase in P-NR1 levels (a), but TNF-α did not produce an increase in P-NR1 at the dose tested (b). c, d, Compared with vehicle (veh), the IL-1β-induced increase in P-NR1 was blocked by IL-1ra (0.01 mm; c), but not by fluorocitrate (FC; 0.01 mm), a glial inhibitor (d). e, IL-1β induced an increase in P-NR1 in vivo. IL-1β (1.5 pmol/500 nl) was microinjected into the ventral Vi/Vc transition zone and Vi/Vc tissues were punched out 30 min after IL-1β injection. Animals subjected to the injection procedure without receiving IL-1β were used as the SHAM control. Saline (500 nl) was injected as a control for IL-1β. Compared with naive rat, IL-1β induced an increase in P-ser896-NR1 that was blocked by IL-1ra (1 nmol). The SHAM procedure and saline did not have an effect on the P-NR1 levels. *p < 0.05; **p < 0.01 vs artificial CSF (aCSF)-treated slices (a–d) or naive rats (e; n = 3–4 per group). Error bars represent SEM.
Figure 10.
Figure 10.
Signal pathways involved in the IL-1R NMDA receptor coupling. The transverse medullary slices, including the Vi/Vc transition zone, was obtained from adult 8- to 10-week-old rats. The slices were incubated with IL-1β for 15 min and the ventral Vi/Vc tissues were harvested by taking punches. a–c, Compared with vehicle (veh), the IL-1β-induced increase in P-NR1 was blocked by the following: chelerythrine (Che, 0.01 mm), a PKC inhibitor (a); 2APB (0.072 mm), an IP3 receptor antagonist (b); but not by an NMDAR channel blocker, MK-801 (0.03 mm; c). d, e, U73122 (0.01 mm; d), a phosphlipase C (PLC) inhibitor, and AACOCF3 (0.01 mm; e), a PLA2 inhibitor, also blocked the effect of IL-1β on P-NR1 levels. U73343 (0.01 mm) and AACOCH3 are inactive analogs of U73122 and AACOCF3, respectively, and were used as negative controls. All inhibitors and inactive analogs were applied 10 min before IL-1β. *p < 0.05 versus artificial CSF (aCSF)-treated slices (n = 3–4 per group). Error bars represent SEM. f, The proposed modulation of NMDAR phosphorylation involving IL-1R signaling. Binding of IL-1β to the IL-1R leads to the recruitment of the IL-1R accessory protein (IL-1RAcP) and the formation of a heterotrimeric complex. The signaling IL-1R complex may stimulate PLC or PLA2, or both, although the intermediate steps are unknown (dashed lines). The downstream effectors of PLA2 and PLC may include activation of PKC through the formation of arachidonic acid (aa), cyclooxygenase2 (COX2)/prostaglandin (PG), IP3 (inositol 1,4,5-trisphosphate), and diacylglycerol (DAG). PKC can directly phosphorylate serine 890 and 896 of the NR1 subunit of the NMDAR and indirectly lead to Src activation and NR2B tyrosine phosphorylation (P). The PI-3-K (phosphatidylinositol-3-kinase)/PKB (protein kinase B or Akt kinase) pathway is also downstream to IL-1R signaling. Whether it participates in regulation of NMDAR is unclear. It is well documented that IL-1R signaling leads to transcriptional regulation of cellular activity. Our results show that the IL-1R signaling is also involved in post-translational regulation of cellular activity through coupling to NMDARs, which may underlie mechanisms of persistent pain.

References

    1. Aimar P, Pasti L, Carmignoto G, Merighi A. Nitric oxide-producing islet cells modulate the release of sensory neuropeptides in the rat substantia gelatinosa. J Neurosci. 1998;18:10375–10388. - PMC - PubMed
    1. Alstergren P, Ernberg M, Kopp S, Lundeberg T, Theodorsson E. TMJ pain in relation to circulating neuropeptide Y, serotonin, and interleukin-1 beta in rheumatoid arthritis. J Orofac Pain. 1999;13:49–55. - PubMed
    1. Anderson LC, Rao RD. Interleukin-6 and nerve growth factor levels in peripheral nerve and brainstem after trigeminal nerve injury in the rat. Arch Oral Biol. 2001;46:633–640. - PubMed
    1. Araque A, Parpura V, Sanzgiri RP, Haydon PG. Tripartite synapses: glia, the unacknowledged partner. Trends Neurosci. 1999;22:208–215. - PubMed
    1. Asghar AU, Cilia La Corte PF, LeBeau FE, Al Dawoud M, Reilly SC, Buhl EH, Whittington MA, King AE. Oscillatory activity within rat substantia gelatinosa in vitro: a role for chemical and electrical neurotransmission. J Physiol (Lond) 2005;562:183–198. - PMC - PubMed

Publication types