. 2007 Aug;18(8):3131-43.
doi: 10.1091/mbc.e06-12-1101. Epub 2007 May 30.

Fast turnover of L1 adhesions in neuronal growth cones involving both surface diffusion and exo/endocytosis of L1 molecules

Affiliations

Fast turnover of L1 adhesions in neuronal growth cones involving both surface diffusion and exo/endocytosis of L1 molecules

Caroline Dequidt et al. Mol Biol Cell. 2007 Aug.

Abstract

We investigated the interplay between surface trafficking and binding dynamics of the immunoglobulin cell adhesion molecule L1 at neuronal growth cones. Primary neurons were transfected with L1 constructs bearing thrombin-cleavable green fluorescent protein (GFP), allowing visualization of newly exocytosed L1 or labeling of membrane L1 molecules by Quantum dots. Intracellular L1-GFP vesicles showed preferential centrifugal motion, whereas surface L1-GFP diffused randomly, revealing two pathways to address L1 to adhesive sites. We triggered L1 adhesions using microspheres coated with L1-Fc protein or anti-L1 antibodies, manipulated by optical tweezers. Microspheres coupled to the actin retrograde flow at the growth cone periphery while recruiting L1-GFP molecules, of which 50% relied on exocytosis. Fluorescence recovery after photobleaching experiments revealed a rapid recycling of L1-GFP molecules at L1-Fc (but not anti-L1) bead contacts, attributed to a high lability of L1-L1 bonds at equilibrium. L1-GFP molecules truncated in the intracellular tail as well as neuronal cell adhesion molecules (NrCAMs) missing the clathrin adaptor binding sequence showed both little internalization and reduced turnover rates, indicating a role of endocytosis in the recycling of mature L1 contacts at the base of the growth cone. Thus, unlike for other molecules such as NrCAM or N-cadherin, diffusion/trapping and exo/endocytosis events cooperate to allow the fast renewal of L1 adhesions.


Figures
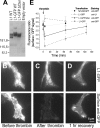
Figure 1.
Figure 1.
Biochemical characterization and distribution of L1–GFP fusion proteins. (A) L1–WT, L1–GFP, L1–GFPΔCter, or the empty vector were transfected into COS cells, and cell lysates were processed for immunoblotting with anti-L1. Note the shift in molecular weight between the various constructs and the absence of nonspecific staining. Neurons transfected for L1–GFP, L1–GFPΔCter, or NrCAM–GFP were treated with thrombin for 100 s, and then they were rinsed and allowed to recover for selected time intervals. Cells were then incubated live with anti-GFP or anti-L1 antibodies for 5 min, fixed, and stained with secondary antibodies conjugated to Alexa 568. (B–D) Representative images of growth cones from cells transfected for L1–GFP (top) and surface stained with anti-GFP (bottom), before (B), right after (C), or 1 h after (D) thrombin treatment. (E) Time course of surface fluorescence recovery after thrombin treatment at time zero, for all conditions. Data are expressed as the average ± SEM of the ratio of Alexa 568/GFP signal for at least 10 growth cones in each condition. Linear regressions through the data give the basal export rates of L1 molecules to the growth cone surface (0.012 and 0.0097 min−1 for L1–GFP and L1–GFPΔCter, respectively).
Figure 2.
Figure 2.
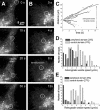
Directed motion of L1–GFP-rich vesicles within growth cones. Neurons transfected with L1–GFP were treated with thrombin for 100 s, and then they were rinsed and observed under the microscope. The distribution of intracellular L1–GFP fluorescence within growth cones was filmed at a rate of three to five images per second. The majority of L1–GFP-rich vesicles stayed confined at the base of the growth cone (arrowheads). (A and B) Representative examples of two vesicles moving forward on the same growth cone (circles), one in the neurite shaft (A) and the other in the lamellipodium (B). (C) The position of such vesicles was tracked, and their displacement was plotted over time. The relationship was fairly linear, the slope of which being taken as the vesicle velocity. The velocity of both anterograde (D) and retrograde (E) moving vesicles was computed, and it is plotted as histograms. By applying an intensity threshold on the L1–GFP fluorescence image, we distinguished a rather uniform less intense zone at the periphery of growth cones (the peripheral domain), and a more intense zone rich in L1-GFP vesicles at the base of growth cones (the central domain). Moving vesicles are classified according to their presence in either of these two areas (black and gray bars, respectively).
Figure 3.
Figure 3.
Random diffusion of individual L1–GFP molecules at the growth cone surface. Neurons transfected for L1–GFP or L1–GFPΔCter were labeled with anti-GFP–coated quantum dots. (A) Differential interference contrast (DIC) image. (B) L1–GFP image. (C) Instantaneous image of QDs bound to the growth cone. (D) Image of the maximum intensity from the QD channel detected for each pixel integrated along a 1-min sequence, representing the global area explored by QD. (E) Image of the average intensity from the QD channel detected for each pixel along a 1-min sequence, representing the preferential zones of QD immobilization. (F) Examples of four trajectories superimposed on the DIC image. (G) Mean squared displacement versus time for typical trajectories, from immobile to very mobile. The linear fits give the corresponding diffusion coefficients. (H) Histogram of the diffusion coefficients for L1–GFP and L1–GFPΔCter computed from 537 and 688 traces, respectively.
Figure 4.
Figure 4.
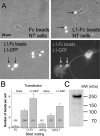
Specific binding of L1–Fc and anti-L1–coated microspheres to neurons. (A) Untransfected neurons (NT) or neurons transfected for L1–GFP were incubated for 0.5 h with latex microspheres coated with human Fc, L1–Fc, or anti-L1 antibodies, and then they were rinsed and fixed. Note the accumulation of L1–GFP fluorescence around L1–Fc- or anti-L1–coated microspheres (white arrows). (B) The number of beads bound per cell in each condition is expressed as mean ± SEM, with the number of cells examined in italics. (C) The purified L1–Fc protein was run on a polyacrylamide gel and immunoblotted with antibodies against L1, showing migration at the expected molecular weight.
Figure 5.
Figure 5.
Microspheres move rearward on growth cones and progressively accumulate L1–GFP molecules. Microspheres coated with L1–Fc, Ncad–Fc, or antibodies against L1 were placed for 10 s at the periphery of growth cones from L1–GFP-transfected neurons, by using an optical trap. (A and B) The movement of the bead and the fluorescence accumulation at the bead contact (arrowheads) were followed for 10 min. The black trace on the white field upper image indicates the bead trajectory, and the bead position is shown at the end of the experiment (for better contrast, we superimposed the white field image of the bead to a DIC image of the growth cone obtained at the end of the sequence). Cells were either left untreated (A) or pretreated with thrombin for 1 min, and then they were rinsed in the presence of PPACK before optical tweezers manipulation (B). The fluorescence level around the bead was normalized by that on adjacent regions and plotted over time for untreated cells (C) or cells pretreated with thrombin (D). Data are expressed as mean ± SEM, and they are fit with a first-order kinetics model (plain curves) (Thoumine et al., 2006). (E) The instantaneous bead velocity is plotted over time for the different bead coatings, pooling data from conditions with or without thrombin, which did not differ in terms of velocity. The number of experiments (between 10 and 20) is given in Table 1.
Figure 6.
Figure 6.
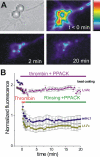
Lack of fluorescence recovery at L1–GFP-rich contacts after GFP cleavage by thrombin. (A) Neurons transfected for L1–GFP were incubated for 0.5 h with anti-L1– or L1–Fc-coated microspheres, leading to fluorescence accumulation around beads. Cells were treated with thrombin for 100 s, resulting in a dramatic decrease in fluorescence around beads, and then they were rinsed with fresh buffer containing a highly selective thrombin inhibitor (PPACK) and imaged for 20 min. (B) The enrichment factor (bead/control area) is plotted over time for L1–Fc and anti-L1 beads, thrombin being applied at time 0. In some experiments (triangles), cells were treated with thrombin + PPACK for 20 min. Data from 15 to 18 individual beads are expressed as mean ± SEM.
Figure 7.
Figure 7.
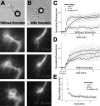
Rapid turnover of L1 molecules within L1–Fc bead contacts at equilibrium. Neurons transfected for L1–GFP or L1–GFPΔCter were incubated for 0.5 h with anti-L1– or L1–Fc-coated microspheres, which recruited L1–GFP up to saturation. The L1–GFP signal on microspheres or on adjacent regions was photobleached at time 0, and the recovery of fluorescence was followed for 12 min. (A) Time sequence of a typical FRAP experiment. (B) Normalized enrichment factor over time. Data are expressed as mean ± SEM, and the plain curves are fits with a diffusion-reaction model (Thoumine et al., 2006). In this analysis, we continue using the enrichment factor (ratio bead/control area), starting with a prebleach value of ∼1.8, and reason essentially on the 80% fraction representing the L1–GFP specifically accumulated at the bead surface. When we photobleach the whole L1–GFP signal at a bead contact, we bleach the 100% fraction, which behaves like L1–GFP outside the bead contact (intracellular + unbound molecules), and which recovers rapidly (no bead curve). We simultaneously bleach the 80% L1–GFP molecules associated with the bead contact, and this fraction recovers more slowly (second regime) for L1–Fc beads. In the case of anti-L1 beads, it does not recover at all, the anti-L1 curve staying at the same level as the “no bead” condition. This demonstrates that these receptors are permanently immobilized by antibodies on the cell surface. (C) FRAP curves for L1–GFPΔCter at L1–Fc contacts in hippocampal neurons and NrCAM-GFP at TAG-1 bead contacts in B104 neuroblastoma cells. The turnover rates calculated from the model are given in Table 2 with the corresponding number of experiments.
Figure 8.
Figure 8.
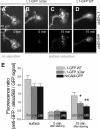
Endocytosis of L1 at the base of growth cones. (A–D) Neurons transfected for L1–GFP, L1–GFPΔCter, or NrCAM–GFP were briefly fed with soluble antibody against GFP, and then they were either fixed immediately (A and B) or placed at 37°C for 15 min to promote internalization of receptor–antibody complexes (C and D). (A) Surface anti-GFP–labeled receptors were stained with fluorescent secondary antibody without cell permeabilization. (B–D) Surface labeling was quenched by high concentrations of unconjugated secondary antibody, and internalized L1–GFP molecules were labeled with fluorescent secondary antibody after brief permeabilization. (E) Ratio of Alexa 568 anti-GFP versus L1–GFP signal on the growth cone area, for the different time points and constructs. Data are expressed as mean ± SEM, with (n) the number of growth cones examined, and data were compared by analysis of variance (ANOVA) and Tukey's test (*p = 0.06; **p < 0.01).
Figure 9.
Figure 9.
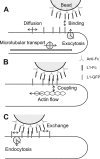
Model showing the cooperation between lateral diffusion and exo/endocytosis events in the dynamics of L1 homophilic contacts. (A) Initial contact formation at the growth cone periphery involves both directed exocytosis and lateral diffusion. (B) Beads rapidly couple to the actin flow and travel to the base of growth cones, as more receptors are being recruited. (C) Mature contacts in the central domain are still capable of turnover and recycle by diffusion/untrapping as well as endocytosis, which occurs preferentially in this region.

Similar articles

Cited by

References

    1. Alberts P., et al. Cross talk between tetanus neurotoxin-insensitive vesicle-associated membrane protein-mediated transport and L1-mediated adhesion. Mol. Biol. Cell. 2003;14:4207–4220. - PMC - PubMed
    1. Alberts P., Rudge R., Irinopoulou T., Danglot L., Gauthier-Rouviere C., Galli T. Cdc42 and actin control polarized expression of TI-VAMP vesicles to neuronal growth cones and their fusion with the plasma membrane. Mol. Biol. Cell. 2006;17:1194–1203. - PMC - PubMed
    1. Boiko T., Vakulenko M., Ewers H., Yap C. C., Norden C., Winckler B. Ankyrin-dependent and -independent mechanisms orchestrate axonal compartmentalization of L1 family members neurofascin and L1/neuron-glia cell adhesion molecule. J. Neurosci. 2007;27:590–603. - PMC - PubMed
    1. Brewer G. J. Thrombin causes cell spreading and redistribution of beta-amyloid immunoreactivity in cultured hippocampal neurons. J. Neurochem. 1996;67:119–130. - PubMed
    1. Brummendorf T., Lemmon V. Immunoglobulin superfamily receptors: cis-interactions, intracellular adapters and alternative splicing regulate adhesion. Curr. Opin. Cell Biol. 2001;13:611–618. - PubMed

Publication types

MeSH terms

Substances

LinkOut - more resources