. 2007 Aug;18(8):3002-14.
doi: 10.1091/mbc.e06-11-1041. Epub 2007 May 30.

Identification of Arabidopsis cyclase-associated protein 1 as the first nucleotide exchange factor for plant actin

Affiliations

Identification of Arabidopsis cyclase-associated protein 1 as the first nucleotide exchange factor for plant actin

Faisal Chaudhry et al. Mol Biol Cell. 2007 Aug.

Abstract

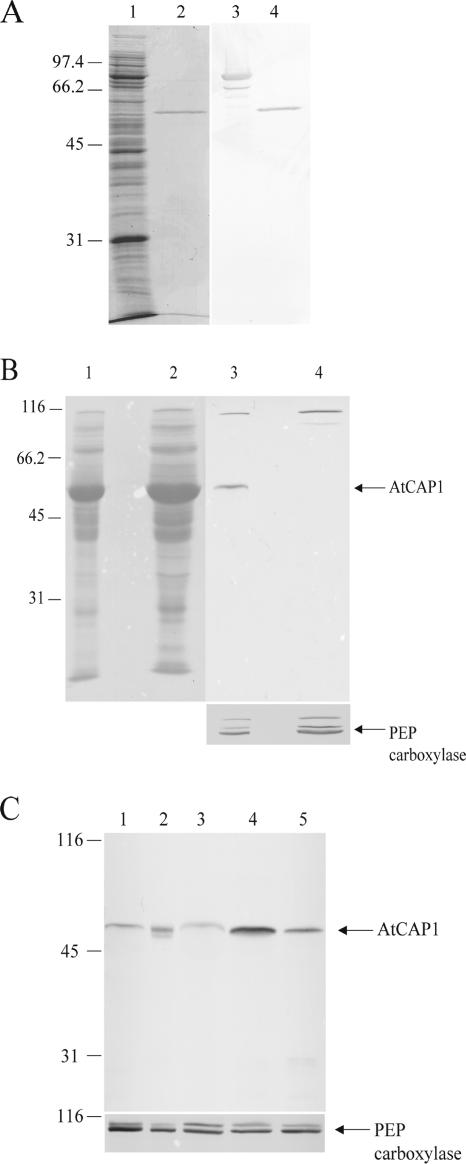
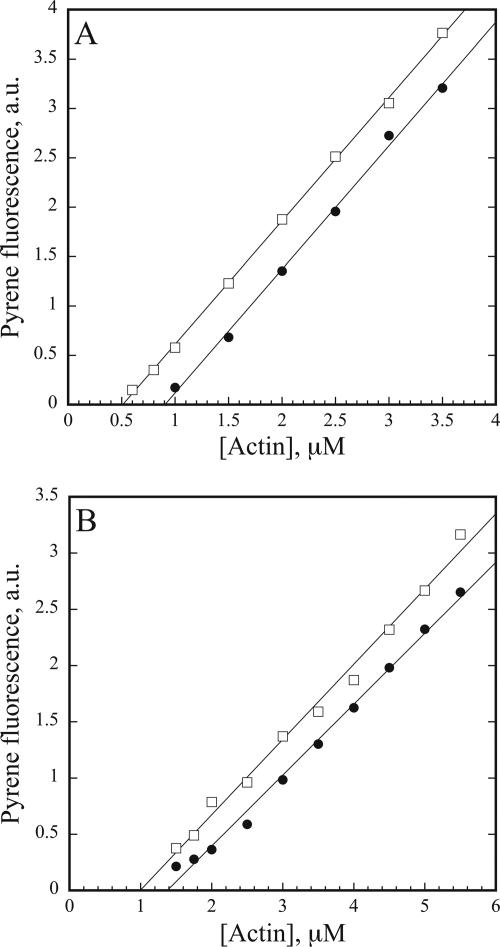
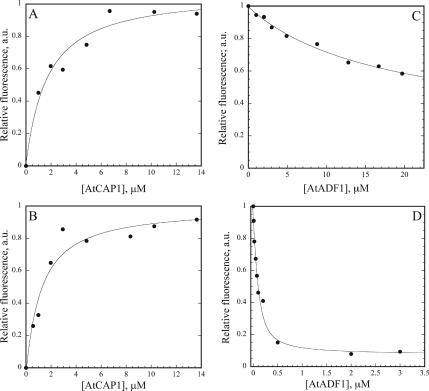
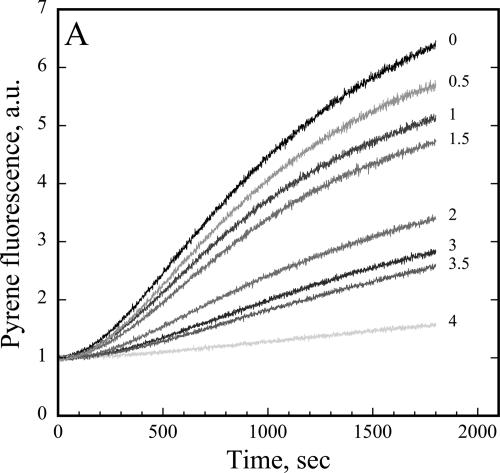
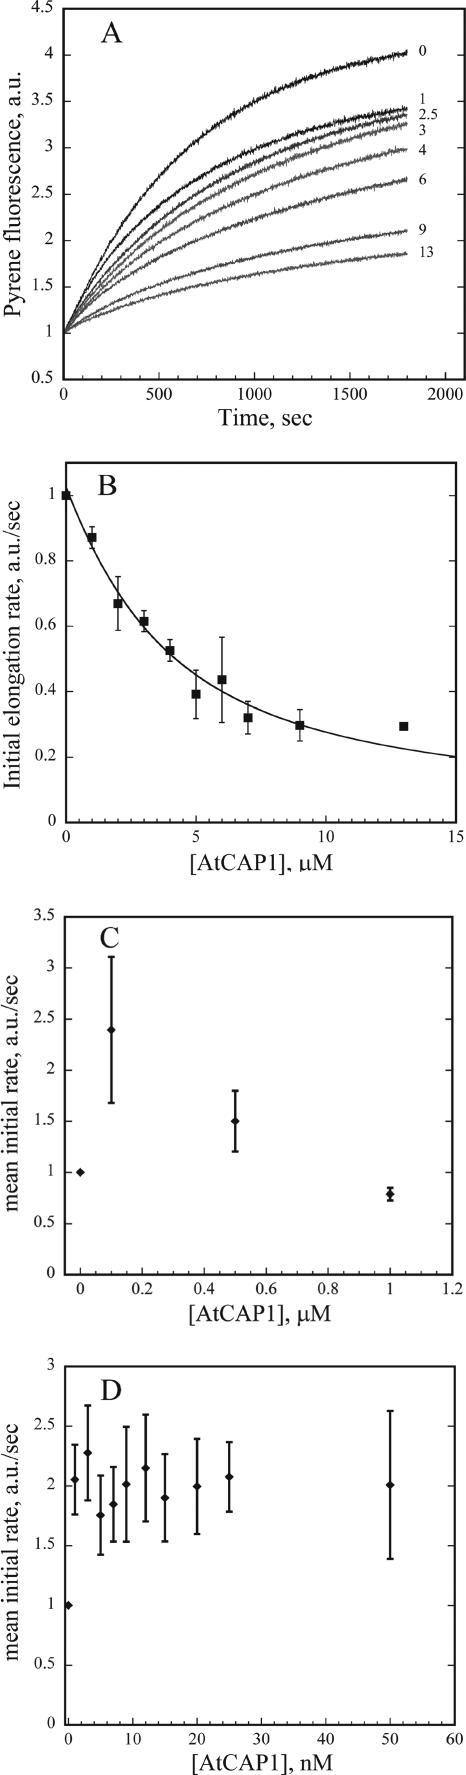
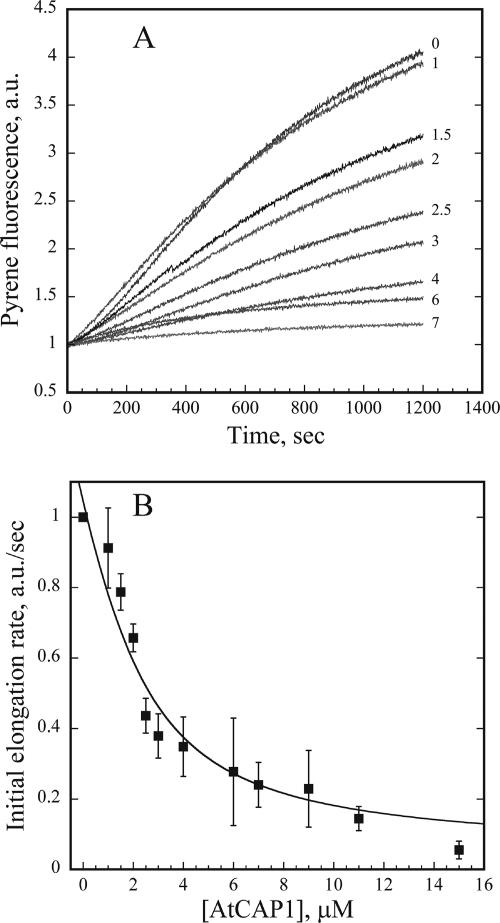
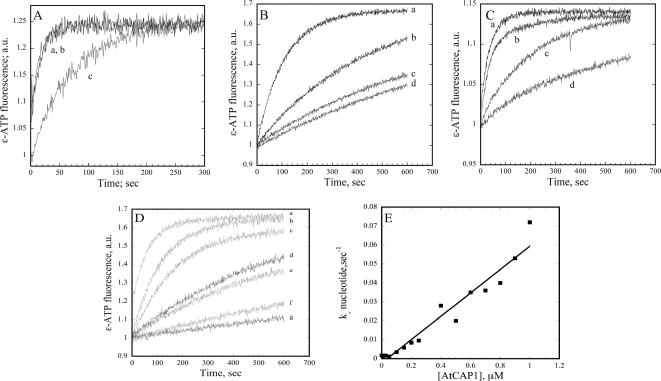
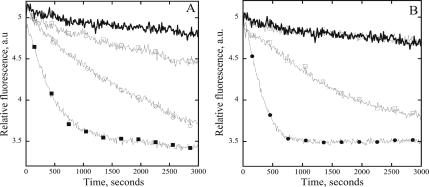
The actin cytoskeleton powers organelle movements, orchestrates responses to abiotic stresses, and generates an amazing array of cell shapes. Underpinning these diverse functions of the actin cytoskeleton are several dozen accessory proteins that coordinate actin filament dynamics and construct higher-order assemblies. Many actin-binding proteins from the plant kingdom have been characterized and their function is often surprisingly distinct from mammalian and fungal counterparts. The adenylyl cyclase-associated protein (CAP) has recently been shown to be an important regulator of actin dynamics in vivo and in vitro. The disruption of actin organization in cap mutant plants indicates defects in actin dynamics or the regulated assembly and disassembly of actin subunits into filaments. Current models for actin dynamics maintain that actin-depolymerizing factor (ADF)/cofilin removes ADP-actin subunits from filament ends and that profilin recharges these monomers with ATP by enhancing nucleotide exchange and delivery of subunits onto filament barbed ends. Plant profilins, however, lack the essential ability to stimulate nucleotide exchange on actin, suggesting that there might be a missing link yet to be discovered from plants. Here, we show that Arabidopsis thaliana CAP1 (AtCAP1) is an abundant cytoplasmic protein; it is present at a 1:3 M ratio with total actin in suspension cells. AtCAP1 has equivalent affinities for ADP- and ATP-monomeric actin (Kd approximately 1.3 microM). Binding of AtCAP1 to ATP-actin monomers inhibits polymerization, consistent with AtCAP1 being an actin sequestering protein. However, we demonstrate that AtCAP1 is the first plant protein to increase the rate of nucleotide exchange on actin. Even in the presence of ADF/cofilin, AtCAP1 can recharge actin monomers and presumably provide a polymerizable pool of subunits to profilin for addition onto filament ends. In turnover assays, plant profilin, ADF, and CAP act cooperatively to promote flux of subunits through actin filament barbed ends. Collectively, these results and our understanding of other actin-binding proteins implicate CAP1 as a central player in regulating the pool of unpolymerized ATP-actin.


Figures

Figure 1.
Figure 1.
AtCAP1 antibody recognizes recombinant and native protein from A. thaliana. (A) Coomassie-stained gel (lanes 1 and 2) and Western immunoblot (lanes 3 and 4) showing the purification of recombinant GST-AtCAP1. Lanes 1 and 3, 5 μg of total extract from bacterial cells; lanes 2 and 4, thrombin-cleaved protein eluate (1 μg). Lanes 3 and 4 were probed with affinity-purified anti-AtCAP1 antibody. Purified, recombinant AtCAP1 migrated at 50–52 kDa. (B) Twenty-five micrograms of A. thaliana wild-type (lanes 1 and 3) and homozygous mutant (lanes 2 and 4) leaf tissue extracts were separated by SDS-PAGE and Ponceau S-stained (lanes 1 and 2); lanes 3 and 4 were probed with polyclonal anti-AtCAP1 antibody (top) and subsequently with PEP carboxylase antibody as a loading control (bottom). Anti-CAP1 recognized an appropriate molecular weight polypeptide in wild-type but not in mutant tissue. (C) Twenty-five micrograms each of extracts from total plant (lane 1), roots (lane 2), leaves (lane 3), stems (lane 4), and flowers (lane 5) were probed with anti-AtCAP1 antibody (top). The same blot was reprobed with anti-PEP carboxylase antibody, which recognized a band of ∼116 kDa, to show loading controls (bottom). Migration of molecular weight standards is given at left in kilodaltons.
Figure 2.
Figure 2.
AtCAP1 changes the critical concentration (Cc) for actin assembly. (A) Representative experiment showed that AtCAP1 changes the steady state Cc for rabbit muscle actin assembly. Increasing concentrations of 1:200 gelsolin:actin (5% pyrene labeled) was polymerized in the absence (squares) and presence (circles) of 1 μM AtCAP1. The Cc values (intercept of line of best fit with the x-axis) were 0.5 μM for actin alone and 0.9 μM with AtCAP1. The resulting Kd value for this experiment was 0.8 μM. (B) Representative experiment performed with maize pollen actin, in the presence of gelsolin to cap filament barbed ends, gives Cc values of 1 μM for actin alone (squares) and 1.4 μM with AtCAP1 (circles), with a resulting Kd = 0.3 μM. a.u., arbitrary fluorescence units.
Figure 3.
Figure 3.
AtCAP1 binds to both ATP– and ADP–G-actin. (A) The increase in fluorescence of 0.2 μM Mg–ATP–G-actin (50% NBD labeled) was plotted as a function of [AtCAP1]. Dissociation equilibrium constants were determined by fitting the data as described in Materials and Methods. A single representative experiment which gave a Kd of 1.6 μM is shown. (B) The affinity of AtCAP1 for ADP–G-actin was determined as outlined above. A single representative experiment, which gave a Kd of 1.1 μM, is shown. (C) The affinity of AtADF1 for ATP–G-actin was followed by quenching of fluorescence. A single representative experiment, which gave a Kd of 17 μM, is shown. (D) The affinity of AtADF1 for ADP–G-actin, from a single representative experiment, gave a Kd of 0.05 μM.
Figure 4.
Figure 4.
AtCAP1 prevents spontaneous actin polymerization. Polymerization of actin monomers (3 μM; 5% pyrene labeled) was measured by fluorescence increase in the presence of various concentrations of AtCAP1. Pyrene fluorescence was plotted versus time after addition of polymerization salts. AtCAP1 concentrations were, from top to bottom: 0, 0.5, 1, 1.5, 2, 3, 3.5, and 4 μM. AtCAP1 suppressed actin nucleation in a dose-dependent manner and reduced the final extent of polymerization.
Figure 5.
Figure 5.
AtCAP1 inhibits actin filament elongation in a dose-dependent manner. (A) Actin monomers (1 μM; 5% pyrene labeled) were supplemented with varying amounts of AtCAP1 and 0.4 μM actin seeds. Pyrene fluorescence was plotted as a function of time after addition of polymerization salts. AtCAP1 concentrations were, from top to bottom: 0, 1, 2.5, 3, 4, 6, 9, and 13 μM. AtCAP1 inhibited actin elongation from uncapped F-actin seeds in a dose-dependent manner. (B) Initial elongation rates were measured for the first 100 s and normalized to the rates in the absence of AtCAP1. The means ± SD from n = 4 experiments are shown. The data were fit as described in Materials and Methods to determine an apparent dissociation constant for AtCAP1 binding to actin monomer (Kd = 1.6 ± 0.1 μM). (C and D) AtCAP1–actin complex adds on to free barbed ends of actin filaments. Initial rates were determined as described for B using 0.01–0.05 μM (D) and 0.1–1 μM AtCAP1 (C). Mean values ± SD from four experiments are plotted.
Figure 6.
Figure 6.
AtCAP1 inhibits pointed end elongation in a dose-dependent manner. (A) Actin monomers (2 μM; 5% pyrene labeled) were supplemented with different concentrations of AtCAP1 and 80 nM gelsolin-actin seeds. Pyrene fluorescence was plotted versus time after the addition of polymerization salts. AtCAP1 concentrations were, from top to bottom: 0, 1, 1.5, 2, 2.5, 3, 4, 6, and 7 μM. (B) Initial elongation rates at the pointed end were measured for the first 100 s, as in Figure 5. The means ± SD for n = 4 experiments were fit as described in Materials and Methods to determine an apparent Kd value of 0.9 ± 0.1 μM.
Figure 7.
Figure 7.
AtCAP1 increases nucleotide exchange on plant and muscle actin. (A) Representative experiment shows nucleotide exchange on 0.5 μM maize pollen actin (curve c). In the presence of 0.5 μM AtCAP, the rate was substantially faster (curve b) compared with actin alone, and it was similar to that observed in the presence of 0.1 μM human profilin (curve a). Not shown: a plant profilin, AtPRF4, and AtADF1 slightly or markedly inhibited nucleotide exchange under these conditions. These experiments were performed in a low ionic strength salt solution. (B) Representative experiment shows nucleotide exchange on 0.5 μM muscle actin at low ionic strength (curve c) and in the presence of 0.05 μM AtCAP1 (curve b). A more dramatic enhancement of nucleotide exchange rate was stimulated by the presence of 0.05 μM human profilin (curve a), whereas 1 μM AtADF1 inhibited nucleotide exchange (curve d). (C) Representative experiment shows nucleotide exchange on 0.5 μM muscle actin under physiological ionic conditions (curve c), 0.05 μM AtCAP1 (curve b), 0.05 μM human profilin (curve a), and 1 μM AtADF1 (curve d). (D) AtCAP1 relieves the inhibition of nucleotide exchange caused by AtADF1. Increasing concentrations of AtCAP1 were added to constant amounts of 0.5 μM AtADF1 and 0.5 μM actin. AtCAP1 concentrations were 0.01 μM (curve f), 0.025 μM (curve e), 0.15 μM (curve c), 0.2 μM (curve b), and 0.5 μM AtCAP1 (curve a). Control curves were actin + 0.5 μM AtADF1 (curve g) and 0.5 μM muscle actin alone (curve d). (E) The dose-dependent effect of the ability of increasing AtCAP1 to relieve nucleotide exchange inhibition by AtADF1 was plotted against nucleotide exchange rate and fit with a linear curve. For this experiment, the exchange rates for 0.5 μM actin alone, actin + 0.5 μM AtADF1, and actin + 1 μM AtCAP1 were 0.0017, 0.0003, and 0.07 a.u./s, respectively.
Figure 8.
Figure 8.
AtCAP1 enhances the rate of actin filament turnover in the presence of ADF/cofilin. Shown is the exchange of fluorescent ε-ADP–actin in filaments for unlabeled ADP–actin, in the presence of various actin binding proteins, as a function of time. (A) Plotted are reactions containing 4 μM actin alone, thick black line; 4 μM actin and 1 μM AtCAP1, open squares; 4 μM actin and 3 μM AtADF1, open circles; and 4 μM actin and 3 μM AtADF1 and 1 μM AtCAP1, closed squares. (B) Plotted are 4 μM actin alone, thick black line; 4 μM actin and 4 μM AtPRF4, open circles; 4 μM actin with 3 μM AtADF1 and 4 μM AtPRF4, open squares; and 4 μM actin with 3 μM AtADF1 and 1 μM AtCAP1 and 4 μM AtPRF4, closed circles. The plots in A and B are from representative experiments performed on the same day. Turnover rates were estimated by fitting the data with a monoexponential function. Mean rates ± SD obtained from four to six experiments were as follows: actin alone = 0.00005 ± 0.00005 a.u./s, actin + ADF = 0.0007 ± 0.0003 a.u./s, actin + AtCAP = 0.00015 ± 0.0001 a.u./s, actin + PRF4 = 0.0009 ± 0.0009 a.u./s, actin + ADF + PRF4 = 0.0009 ± 0.0006 a.u./s, actin + ADF + AtCAP = 0.0017 ± 0.0011 a.u./s, and actin + ADF + CAP + PRF4 = 0.0021 ± 0.0015 a.u./s.

Similar articles

Cited by

References

    1. Alonso J. M., et al. Genome-wide insertional mutagenesis of Arabidopsis thaliana. Science. 2003;301:653–657. - PubMed
    1. Andrianantoandro E., Pollard T. D. Mechanism of actin filament turnover by severing and nucleation at different concentrations of ADF/cofilin. Mol. Cell. 2006;24:13–23. - PubMed
    1. Balcer H. I., Goodman A. L., Rodal A. A., Smith E., Kugler J., Heuser J. E., Goode B. L. Coordinated regulation of actin filament turnover by a high-molecular-weight Srv2/CAP complex, cofilin, profilin, and Aip1. Curr. Biol. 2003;13:2159–2169. - PubMed
    1. Barrero R. A., Umeda M., Yamamura S., Uchimiya H. Arabidopsis CAP regulates the actin cytoskeleton necessary for plant cell elongation and division. Plant Cell. 2002;14:149–163. - PMC - PubMed
    1. Barrero R. A., Umeda M., Yamamura S., Uchimiya H. Over-expression of Arabidopsis CAP causes decreased cell expansion leading to organ size reduction in transgenic tobacco plants. Ann. Bot. 2003;91:599–603. - PMC - PubMed

Publication types

MeSH terms