. 2007 Aug;18(8):3015-25.
doi: 10.1091/mbc.e06-09-0869. Epub 2007 May 30.

Evidence that mono-ADP-ribosylation of CtBP1/BARS regulates lipid storage

Affiliations

Evidence that mono-ADP-ribosylation of CtBP1/BARS regulates lipid storage

René Bartz et al. Mol Biol Cell. 2007 Aug.

Abstract

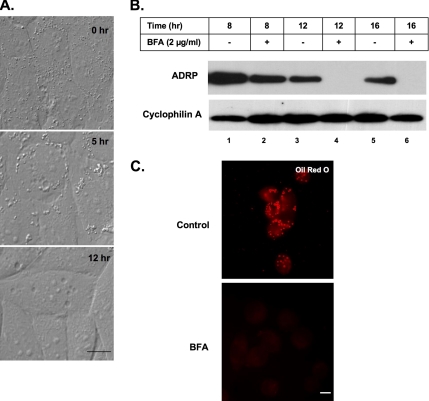
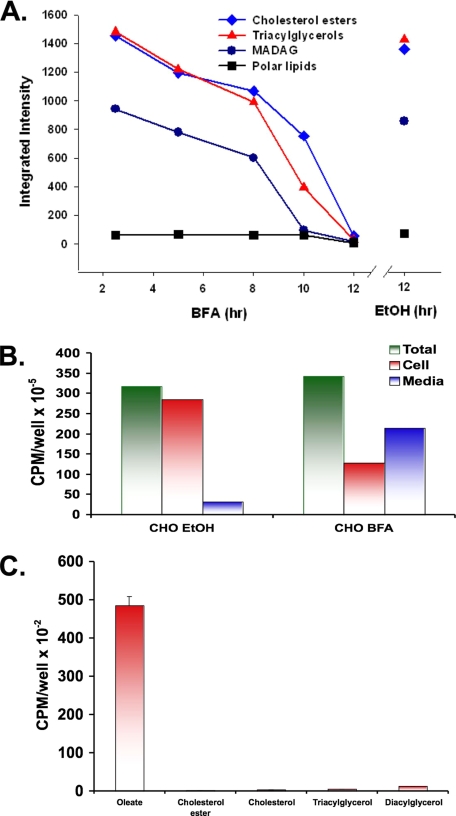
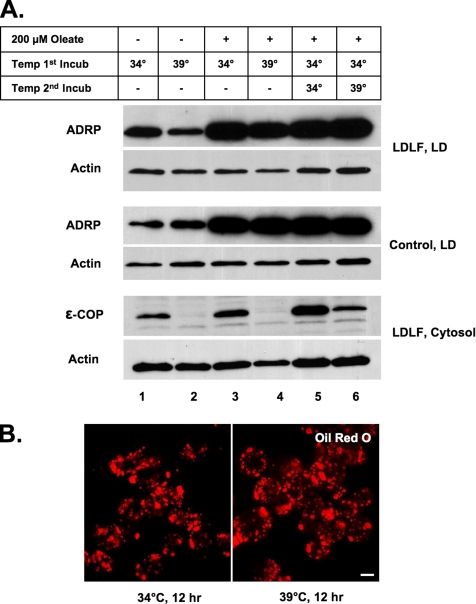
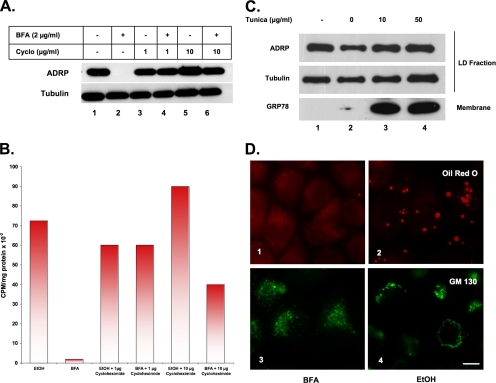
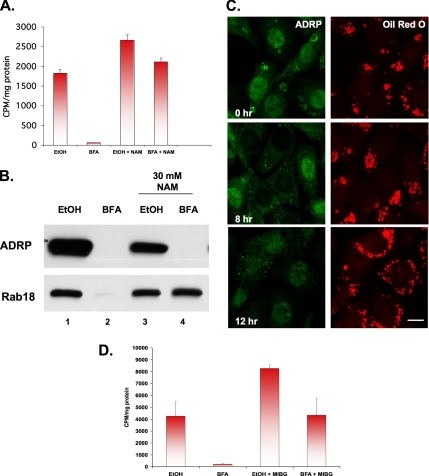
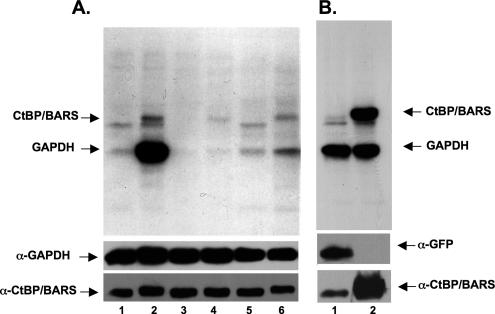
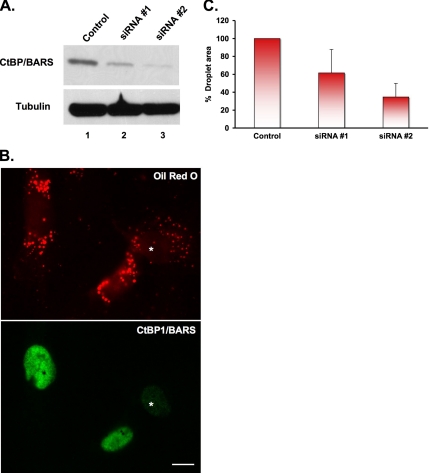
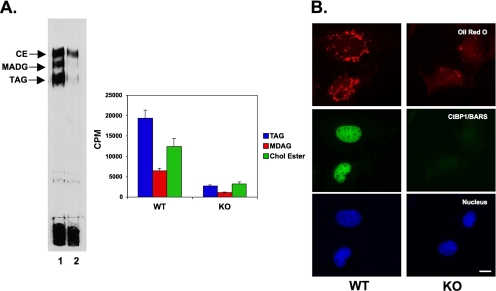
Mono-ADP-ribosylation is emerging as an important posttranslational modification that modulates a variety of cell signaling pathways. Here, we present evidence that mono-ADP-ribosylation of the transcriptional corepressor C terminal binding protein, brefeldin A (BFA)-induced ADP-ribosylated substrate (CtBP1/BARS) regulates neutral lipid storage in droplets that are surrounded by a monolayer of phospholipid and associated proteins. CtBP1/BARS is an NAD-binding protein that becomes ribosylated when cells are exposed to BFA. Both endogenous lipid droplets and droplets enlarged by oleate treatment are lost after 12-h exposure to BFA. Lipid loss requires new protein synthesis, and it is blocked by multiple ribosylation inhibitors, but it is not stimulated by disruption of the Golgi apparatus or the endoplasmic reticulum unfolded protein response. Small interfering RNA knockdown of CtBP1/BARS mimics the effect of BFA, and mouse embryonic fibroblasts derived from embryos that are deficient in CtBP1/BARS seem to be defective in lipid accumulation. We conclude that mono-ADP-ribosylation of CtBP1/BARS inactivates its repressor function, which leads to the activation of genes that regulate neutral lipid storage.


Figures

Figure 1.
Figure 1.
Effect of BFA on uptake and storage of oleate. (A) NRK cells were continuously grown in the presence of 2 μg/ml BFA plus 100 μM oleate for the indicated time. These images are taken from the movie supplied in supplementary data. (B) CHO K2 cells were incubated in the presence of either 2 μg/ml BFA or EtOH carrier for the indicated time. Droplet-enriched fractions were prepared, equal amounts of protein separated on 12% SDS-PAGE and immunoblotted with α-ADRP and α-cyclophilin A IgG (loading control). (C) CHO cells were incubated in the presence of 2 μg/ml BFA (BFA) or EtOH carrier (control) for 12 h. Cells were fixed and processed to visualize neutral lipids with oil red O. Bar, 10 μm.
Figure 2.
Figure 2.
BFA stimulates release of free fatty acids from stored neutral lipid droplets. (A) CHO K2 cells were incubated in the presence of 2 μg/ml BFA for the indicated time at 37°C or EtOH carrier for 12 h. Purified droplets were prepared and the lipids extracted, separated by TLC, stained with iodine, and quantified using ImageJ software. (B) CHO K2 cells were incubated in the presence of 100 μM oleate plus 12 μCi of [3H]oleate for 24 h. Cells were then washed and incubated in the presence of 2 μg/ml BFA or EtOH carrier for 12 h at 37°C. Media were collected, the cells washed and homogenized, and the radioactivity in both samples was measured. (C) The 3H lipids in the medium from the BFA-treated cells was extracted and separated by TLC along with the standards for the indicated lipids. The area in the TLC next to the indicated standard was scraped, and the amount of radioactivity was measured.
Figure 3.
Figure 3.
BFA-stimulated loss of lipid droplets is not dependent on Golgi fragmentation (A and B). (A) Normal (control) and temperature-sensitive CHO LDLF cells were grown either in the presence or absence of 200 μM oleate at the permissive (34°C) or restrictive (39°C) temperature for 12 h, or they were incubated in the presence of 200 μM oleate at the permissive temperature before shifting to the restrictive temperature for 6 h (lanes 5 and 6). Either droplet-enriched (LD) or cytosol fractions were prepared, and equal amounts of protein were separated by 12% SDS-PAGE and immunoblotted with α-ADRP and α-actin IgG (loading control). (B) LDLF cells were grown in the presence of 200 μM oleate for 12 h. The oleate containing medium was removed, and the cells incubated at either the permissive or restrictive temperature for an additional 12 h before staining with oil red O.
Figure 4.
Figure 4.
BFA-stimulated lipid loss requires protein synthesis (A and B), and it is not regulated by UPR (C) or SREBP (D). (A) CHO K2 cells were incubated in the presence of BFA or EtOH carrier plus the indicated concentration of cycloheximide for 12 h. Droplet-enriched fractions were prepared, and equal amounts of protein were separated by 12% SDS-PAGE and immunoblotted with α-ADRP and α-tubulin IgG (load control). (B) CHO cells were incubated in the presence of 5 μCi of [3H]oleate for 24 h to label endogenous neutral lipids, washed, and then incubated further in the presence of BFA or EtOH carrier plus the indicated concentration of cycloheximide. Lipids were extracted from the droplet-enriched fraction with acetone, and the specific radioactivity was determined. The figure shown is representative of three independent experiments. (C) CHO K2 cells were incubated in the presence of the indicated concentration of tunicamycin or DMSO carrier for 12 h at 37°C. Droplet-enriched fraction and total membranes were isolated, and equal amounts of protein separated by 12% SDS-PAGE and immunoblotted with α-ADRP and α-tubulin IgG (loading control). Total membranes from the same preparation were separated the same way, but they were immunoblotted with α-GRP78 (BIP) IgG. (D) CHO cells deficient in SREBP S1P (SRD-12A) were incubated in the presence of either 2 μg/ml BFA (1 and 3) or EtOH carrier (2 and 4) for 12 h. Cells were fixed and processed for immunofluorescence analysis to detect GM130 (3 and 4) or oil red O staining (lanes 1 and 2). Bar, 10 μm.
Figure 5.
Figure 5.
BFA-stimulated loss of lipid droplets is blocked by inhibitors of mono-ADP ribosylation. (A) CHO K2 cells were incubated in the presence of 5 μCi of [3H]oleate for 24 h to label neutral lipids, washed, and then incubated further in the presence of 2 μg/ml BFA or EtOH carrier for 12 h at 37°C in the presence or absence of 30 mM NAM. Droplet-enriched fractions were prepared, and the lipid was extracted with acetone and counted. Each bar is the average of three experiments ± SE. (B) CHO K2 cells were incubated in the presence of 2 μg/ml BFA or EtOH carrier plus or minus 30 mM NAM. Purified droplets were prepared, and equal-volume fractions were separated by 12% SDS-PAGE and immunoblotted with α-ADRP and α-Rab18 IgG. (C) NRK cells were processed as described in Figure 1B to increase the number of droplets before incubating the cells in the presence of 2 μg/ml BFA plus 30 mM NAM for the indicated time. Cells were stained with α-ADRP IgG and oil red O. Bar, 10 μm. (D) The experimental design is the same as described in A, except that 100 μM MIBG was used instead of NAM. Each bar is the average of triplicate measurements ± SE.
Figure 6.
Figure 6.
BFA stimulates ribosylation of CtBP/BARS and GAPDH. (A) Cytosol from CHO cells containing [32P]-NAD was either not treated (lane 1), incubated in the presence of BFA (lane 2), incubated in the presence of ribosylaton inhibitors NAM (lane 3) or MIBG (lane 5), incubated in the presence of BFA plus 30 mM NAM (lane 4) or BFA plus 100 μM MIBG (lane 6) for 2 h at 37°C. The reaction was stopped and membranes and cytosol were separated by centrifugation. The supernatant fraction was separated by SDS-PAGE, transferred to PVDF-membrane and processed for autoradiography. The PVDF-membrane was then processed for detection of GAPDH and CtBP1/BARS by immunoblotting. (B) Post-nuclear supernatant from Cos-7 cells expressing the cDNA for either GFP (lane 1) or CtBP1/BARS (lane 2) was incubated in the presence of BFA plus [32P]-NAD as described. The reaction was stopped, and the supernatant fraction processed as described above. The PVDF-membrane was then processed for immunoblotting to detect CtBP1/BARS or GFP.
Figure 7.
Figure 7.
Knockdown of CtBP1/BARS mimics the effects of BFA. (A) SV589 cells transfected with two different siRNA oligonucleotides for CtBP1/BARS (lanes 2 and 3) or an siRNA against microsomal transfer protein (control, lane 1) were cultured 4 d posttransfection before processing for immunoblotting using an α-CtBP1/BARS and α-tubulin IgG (loading control). (B) SV589 cells were processed similar to as described in A, except at day 3 posttransfection cells were seeded onto coverslips and incubated an additional day. Cells were washed and processed to localize CtBP1/BARS by immunofluorescence and droplets with oil red O. The asterisk marks a transfected cell that has a reduced level of CtBP1/BARS staining in the nucleus and decreased amount of oil red O staining compared with surrounding cells. Bar, 10 μm. (C) The area of the lipid droplets in the cells processed in B was then evaluated: the total droplet area in cells (120 cells/data point) exhibiting a >70% reduction in nuclear staining of CtBP1/BARS was analyzed using ImageJ and compared with control transfected cells. Each bar is the average of three experiments ± SE.
Figure 8.
Figure 8.
CtBP/BARS-deficient MEFs are defective in lipid storage. Mouse embryo fibroblasts (WT and CtBP1/BARS1/2−/−) were cultured as described in text. (A) One set of cells was incubated in the presence of 50 μCi of [3H]oleate] for 24 h, washed, and processed to extract lipids as described in text. An equal volume of lipid extract from the two cells was separated by TLC, and then it was processed for autoradiography (left). In a separate experiment (right), equal volumes of lipid extract from the two cell lines were separated, scraped, and counted in a scintillation counter. The result is the average of three samples plus the SD. (B) WT and KO fibroblasts were grown as described in text. Cells were fixed and stained with α-CtBP1/BARS IgG, and the nucleus was visualized with Hoechst dye and the neutral lipids with oil red O. Bar, 10 μm.

Similar articles

Cited by

References

    1. Agarwal A. K., Auchus R. J. Minireview: cellular redox state regulates hydroxysteroid dehydrogenase activity and intracellular hormone potency. Endocrinology. 2005;146:2531–2538. - PubMed
    1. Bartz R., Li W. H., Venables B., Zehmer J. K., Roth M. R., Welti R., Anderson R. G., Liu P., Chapman K. D. Lipidomics reveals that adiposomes store ether lipids and mediate phospholipid traffic. J. Lipid Res. 2007;48:837–847. - PubMed
    1. Bligh E. G., Dyer W. J. A rapid method of total lipid extraction and purification. Can. J. Biochem. Physiol. 1959;37:911–917. - PubMed
    1. Brasaemle D. L., Dolios G., Shapiro L., Wang R. Proteomic analysis of proteins associated with lipid droplets of basal and lipolytically stimulated 3T3–L1 adipocytes. J. Biol. Chem. 2004;279:46835–46842. - PubMed
    1. Corda D., Di Girolamo M. Functional aspects of protein mono-ADP-ribosylation. EMBO J. 2003;22:1953–1958. - PMC - PubMed

Publication types

LinkOut - more resources