. 2007 Aug;18(8):3169-79.
doi: 10.1091/mbc.e06-09-0779. Epub 2007 May 30.

Rab11A controls the biogenesis of Birbeck granules by regulating Langerin recycling and stability

Affiliations

Rab11A controls the biogenesis of Birbeck granules by regulating Langerin recycling and stability

Stéphanie Uzan-Gafsou et al. Mol Biol Cell. 2007 Aug.

Abstract

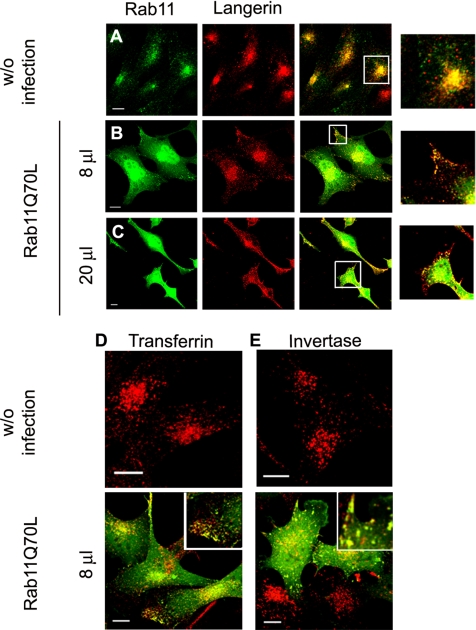
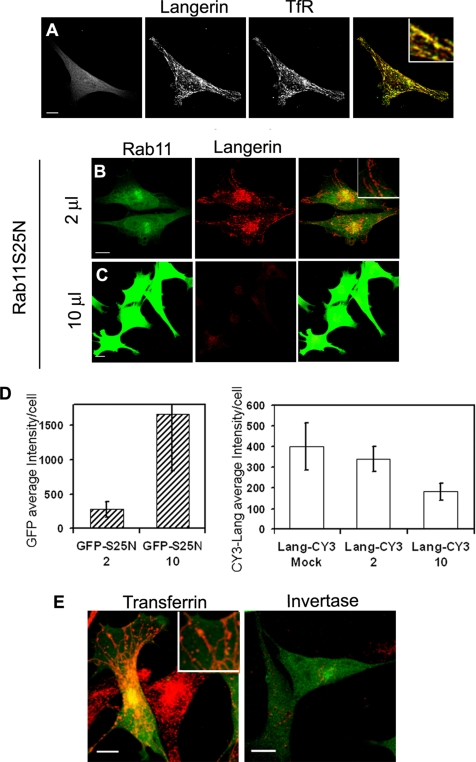
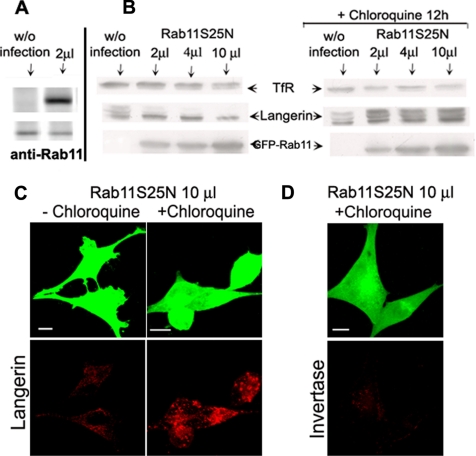
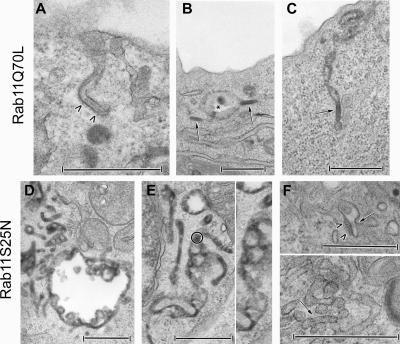
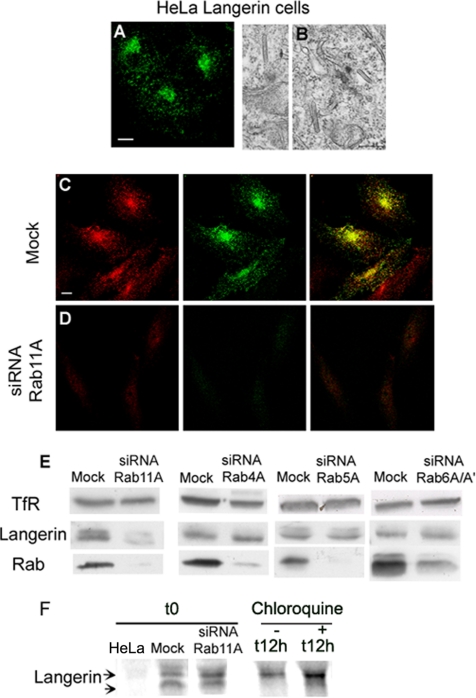
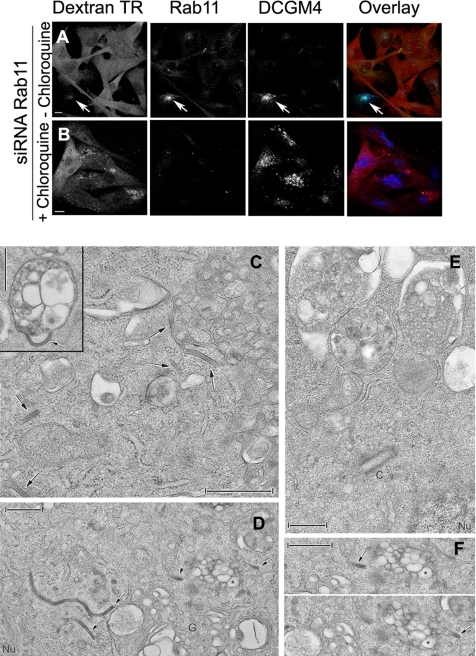
The extent to which Rab GTPases, Rab-interacting proteins, and cargo molecules cooperate in the dynamic organization of membrane architecture remains to be clarified. Langerin, a recycling protein accumulating in the Rab11-positive compartments of Langerhans cells, induces the formation of Birbeck granules (BGs), which are membrane subdomains of the endosomal recycling network. We investigated the role of Rab11A and two members of the Rab11 family of interacting proteins, Rip11 and RCP, in Langerin traffic and the biogenesis of BGs. The overexpression of a dominant-negative Rab11A mutant or Rab11A depletion strongly influenced Langerin traffic and stability and the formation of BGs, whereas modulation of other Rab proteins involved in dynamic regulation of the endocytic-recycling pathway had no effect. Impairment of Rab11A function led to a missorting of Langerin to lysosomal compartments, but inhibition of Langerin degradation by chloroquine did not restore the formation of BGs. Loss of RCP, but not of Rip11, also had a modest, but reproducible effect on Langerin stability and BG biogenesis, pointing to a role for Rab11A-RCP complexes in these events. Our results show that Rab11A and Langerin are required for BG biogenesis, and they illustrate the role played by a Rab GTPase in the formation of a specialized subcompartment within the endocytic-recycling system.


Figures

Figure 1.
Figure 1.
Effects of Rab11AQ70L overexpression on Langerin distribution and transferrin and invertase internalization in M10-22E cells. As a control, untransduced M10-22E cells (A) were labeled with anti-Rab11 serum revealed with donkey anti-rabbit A488 and with the anti-Langerin mAb DCGM4 revealed with donkey anti-mouse Cy3. Cell transductions were carried out as described in Materials and Methods by using low (8 μl of stock solution) (B) or high (20 μl of stock solution) (C) concentrations of recombinant adenoviruses encoding the constitutively active chimeric protein GFP–Rab11AQ70L. Eighteen to 20 h after transduction, the cells were labeled with DCGM4 (B and C) revealed with donkey anti-mouse Cy3. Untransduced cells (top) and GFP-Rab11AQ70L-transduced cells (bottom) were incubated with either Cy3-transferrin (D) or Cy3-invertase (E) for 1 h at 37°C before fixation. All image acquisition parameters were identical for B and C. Insets at higher magnification are included to improve the visualization of structural details in the merged images (A–C and E). To allow a better appreciation of the occurrence of colocalization, the fluorescence signal corresponding to the GFP channel was manually reduced in the zoomed images of B and C. Bars, 10 μm.
Figure 2.
Figure 2.
Effects of Rab11AS25N overexpression on Langerin levels and distribution and transferrin and invertase internalization in M10-22E cells. Cells infected with GFP–Rab11AS25N (A, left) were labeled with an antiserum against the cytoplasmic domain of Langerin revealed with anti-rabbit Cy3 (A, middle) and with an anti-TfR mAb revealed with anti-mouse Cy5 (A, right). The overlay image in A corresponds to the merging of Langerin and TfR staining and shows that the distributions of the two molecules are strongly correlated. Cells transduced with two different doses (2 μl of stock solution (B) or 10 μl (C)) of recombinant adenoviruses encoding the dominant-negative mutant GFP–Rab11AS25N were labeled with the anti-Langerin mAb DCGM4 (B and C) revealed with donkey anti-mouse Cy3. Bars, 10 μm. All images were acquired with an SP2 AOBS confocal microscope. The fluorescence intensities of GFP-Rab11AS25N and Langerin (D) were quantified as described in Materials and Methods by using stacks of images acquired with a wide-field microscope. Values are means ± SD of the average intensity per cell with n = 19, 29, and 23 cells for the mock, 2- and 10-μl experimental conditions, respectively. Cells infected with a low dose (2 μl) of GFP–Rab11AS25N were incubated with 10 μg of Cy3-transferrin (E, left) or Cy3-invertase (E, right) for 1 h at 37°C. Higher magnification insets are included to improve the visualization of structural details in the merged images (A, B, and E). Bars, 10 μm.
Figure 3.
Figure 3.
Effects of Rab11AS25N overexpression on Langerin levels in M10-22E cells. Immunoblotting was used to compare the levels of TfR, Langerin, and GFP–Rab11A in uninfected cells and cells infected with increasing amounts (2, 4, or 10 μl) of Rab11AS25N adenoviruses, in the presence (B, right) or absence (B, left) of 50 μM chloroquine, as described in Materials and Methods. Proteins were separated by SDS-PAGE in 12% acrylamide gels and blotted onto membranes, with equivalent amounts of protein being loaded in each lane. The positions of TfR, Langerin, and GFP–Rab11A are indicated by arrows. Blots are representative of three independent experiments with individual blots being probed for all three proteins. As a control for endogenous Rab11 versus GFP–Rab11AS25N expression, both proteins were probed with anti-Rab11 antibodies in uninfected cells (without infection) and cells infected with 2 μl of GFP–Rab11AS25N adenoviruses (A). M10-22E cells infected with 10 μl of Rab11AS25N were incubated with (C, right, and D) or without (C, left) 50 μM chloroquine, as described in Materials and Methods. The cells were then immunolabeled with the anti-Langerin mAb DCGM4 (C) or incubated with Cy3-invertase for 1 h at 37°C before fixation (D).
Figure 4.
Figure 4.
Effects of Rab11A recombinant adenoviruses on the distribution and presence of Birbeck granules in M10-22E cells. M10-22E cells were transduced with recombinant adenoviruses encoding GFP–Rab11AQ70L (20 μl [?] of stock solution) (A–C) or GFP–Rab11AS25N (2 μl of stock solution) (D–F), in the presence of 10 mg/ml HRP and/or a gold-labeled anti-Langerin mAb during the last 30 min of infection. An open-ended “BG-like structure” appended to the cell surface and coated over its entire length (arrowheads) is shown in A. Cytosolic BGs (arrows) are essentially located at the cell periphery, close to the plasma membrane. They are either isolated (B) or continuous with vacuolar endosomal structures (star) (B) and tubular membrane structures (C). As shown in D and E, tubular and vacuolar HRP+ networks occur in M10-22E cells expressing Rab11AS25N, with variable proportions of each type of network between cells. Thus, the vacuolar component is readily seen in D, whereas the tubular component predominates in E. These networks are linked to the early endosomal pathway, as shown by the occasional presence of gold-labeled anti-Langerin mAbs (a gold-labeled area in E is circled and enlarged on the right-hand side). In contrast, BGs are absent from these tubular networks. Only very occasionally (F), small tubular structures resembling BGs (arrow) with a very short, thin, central striation and a surrounding coat (arrowheads) can be seen, either apparently isolated in the cytosol or connected to the tubular network. Bars, 0.5 μm.
Figure 5.
Figure 5.
Effects of Rab11A knockdown on Langerin levels in Langerin+ HeLa cells. Transfected HeLa cells expressing Langerin were analyzed by immunofluorescence after staining with the anti-Langerin mAb DCGM4 (A), and the presence of BGs was checked by electron microscopy (B). Langerin+ HeLa cells were either mock treated (C) or treated with Rab11A1 siRNA (D) for 72 h, before labeling with either an anti-Rab11 serum (red) or the anti-Langerin mAb (green). Note the high efficiency of Rab11A knockdown in Langerin+ HeLa cells (compare C and D, for which the acquisition parameters were identical). The distributions of the two molecules are strongly correlated in untreated cells (C), whereas the extinction of Langerin parallels the knockdown of Rab11A (D). These images are representative of five independent experiments. Bars, 10 μm. Levels of TfR, Langerin, Rab11, Rab4, Rab5a, and Rab6 in mock-treated cells (mock) or cells treated with siRNA against Rab11A, Rab4A, Rab5A, or Rab6A/A′ were assayed by immunoblotting (E). The data shown are representative of five independent experiments for Rab11A siRNA (see Figure 7B for a quantitative analysis) and two independent experiments for the other siRNAs. Proteins were separated by SDS-PAGE in 12% acrylamide gels and blotted onto membranes. Equivalent amounts of total protein were loaded in each lane, and all proteins were tested on the same blots. Metabolic labeling of Langerin+ HeLa cells (F) treated with Rab11A siRNA was followed by immunoprecipitation of Langerin. Pulse-labeled Langerin+ HeLa cells transfected with Rab11A siRNA were also treated (+) or not (−) for various chase times with 50 μM chloroquine. Time 0 (t0) corresponds to the Langerin immunoprecipitate in cells transfected with Rab11A1 siRNA or not (mock) and metabolically labeled for 30 min. Langerin was also immunoprecipitated from normal HeLa cells under identical conditions and time 0 of a pulse-chase experiment is presented here. In samples treated with chloroquine for the previous 12 h, the Langerin signal is found in a lower band corresponding to the newly synthesized immature form of the molecule. After only 30 min of chase, higher bands corresponding to more mature forms of the glycoprotein already occur whereas only the fuzzy top bands are still visible after 12 h of chase with (+) or without (−) chloroquine. All immunoprecipitations were carried out with lysates prepared from equivalent numbers of cells, and results shown are from one experiment representative of three independent experiments.
Figure 6.
Figure 6.
Birbeck granule formation requires the presence of both Langerin and Rab11A. M10-22E cells, comicroinjected with siRNA against Rab11A and Texas Red-dextran (A and B, left [red]), were incubated with (B) or without (A) 50 μM chloroquine, as described in Materials and Methods. The cells were then immunolabeled with an anti-Rab11 serum (middle, green) and the anti-Langerin mAb DCGM4 (right, blue). Merged images are shown in A and B. Bars, 10 μm. (C) Many BGs (arrows) are present in the cytosol, either isolated or continuous with and/or in the close vicinity of multivesicular compartments (see inset and the BGs visible in the top right-hand corner). (D) Many BGs, some of them particularly long, are also present in the perinuclear (Nu) and Golgi (G) areas. The multivesicular compartment visible in the middle on the right and indicated with a star is viewed from different angles in F. Note that the two structures (arrows) on either side of this multivesicular endosome are BGs (F, top and bottom). (E) In cells treated with both siRNA against Rab11A and chloroquine, BGs are absent from the pericentriolar area and the limiting membranes of the multivesicular compartments. Bars, 0.5 μm.
Figure 7.
Figure 7.
Rab11A–RCP moderately regulates Langerin stability and Birbeck granule biogenesis. (A) Immunoblotting was used to assess levels of TfR, Langerin, Rab11, RCP, and Rip11 in Langerin+ HeLa cells, mock treated (mock), or treated with siRNA against Rab11A, RCP, or Rip11. The data shown are representative of five independent experiments for Rab11A and RCP siRNA and two experiments for Rip11 siRNA. Proteins were separated by SDS-PAGE in 12% acrylamide gels and blotted onto membranes. Equivalent amounts of total protein were loaded in each lane, and each blot was probed for all the proteins tested. (B) The decreases in Langerin and TfR expression were compared in cells treated with siRNA against Rab11A (5 experiments) or siRNA against RCP (5 experiments). Quantitative data derived from Western blots are presented as the ratio of the decrease in Langerin expression to the decrease in TfR expression and are normalized by the parallel results obtained in mock-treated cells (10 experiments). M10-22E cells, comicroinjected with siRNA against Rab11A (C) or siRNA against RCP (D) and Texas Red-dextran (Dextran TR, C and D, left), were immunolabeled with anti-Langerin (Langerin, C and D, middle) or anti-TfR antibodies (C and D, right) revealed with donkey anti-rabbit A488 or anti-mouse Cy5 secondary antibodies, respectively. Image stacks were acquired and the resulting immunofluorescence signals quantified (E) as described in Materials and Methods. Data are presented as the average fluorescence intensity (±SD) per cell for Langerin (left) and TfR (right) in cells microinjected with siRNA against Rab11A (n = 25) or RCP (n = 31) and compared with results for cells microinjected with Texas Red-dextran only (mock, n = 25). Student's t test was used to analyze the differences in Langerin content between cells mock treated and treated with Rab11A siRNA (p < 0.0001) and between cells mock treated and treated with RCP siRNA (p = 0.015). Quantitative analysis of the number of BG profiles per cell was performed in cells treated with Rab11A siRNA or mock treated, in the presence or absence of chloroquine (F), or in cells treated with siRNA against RCP, Rab4A, or Rab5A or mock treated (G). The number of cells examined per condition was 10 in F (but 25 for cells treated with chloroquine and siRNA against Rab11A) and 15 in G. Note the low specificity of the reduction in BG numbers in RCP-depleted cells. Only cells visible in their totality were counted, considering only sections passing through the centro-cellular region and after tilting each cell to examine it from different angles and check that no BGs had been omitted.

References

    1. Agard D. A., Hiraoka Y., Shaw P., Sedat J. Fluorescence microscopy in three dimensions. Methods Cell Biol. 1989;30:353–377. - PubMed
    1. Angenieux C., et al. The cellular pathway of CD1e in immature and maturing dendritic cells. Traffic. 2005;6:286–302. - PubMed
    1. Birbeck M. S., Breathnach A. S., Everall J. D. An electron microscope study of basal melanocytes and high-level clear cells (Langerhans cells) in vitiligo. J. Invest. Dermatol. 1961;37:51–63.
    1. Calhoun B. C., Lapierre L. A., Chew C. S., Goldenring J. R. Rab11a redistributes to apical secretory canaliculus during stimulation of gastric parietal cells. Am. J. Physiol. 1998;275:C163–C170. - PubMed
    1. Chartier C., Degryse E., Gantzer M., Dieterle A., Pavirani A., Mehtali M. Efficient generation of recombinant adenovirus vectors by homologous recombination in Escherichia coli. J. Virol. 1996;70:4805–4810. - PMC - PubMed

Publication types

MeSH terms

LinkOut - more resources