

doi: 10.2105/AJPH.2006.093112.
Epub 2007 May 30.
Persistent clusters of mortality in the United States
Affiliations
- PMID: 17538052
- PMCID: PMC2089111
- DOI: 10.2105/AJPH.2006.093112
Item in Clipboard
Persistent clusters of mortality in the United States
Am J Public Health.
2007 Dec.
Abstract
We explored how place shapes mortality by examining 35 consecutive years of US mortality data. Mapping age-adjusted county mortality rates showed both persistent temporal and spatial clustering of high and low mortality rates. Counties with high mortality rates and counties with low mortality rates both experienced younger population out-migration, had economic decline, and were predominantly rural. These mortality patterns have important implications for proper research model specification and for health resource allocation policies.
Figures
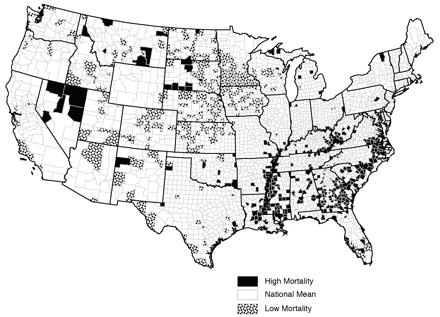
US counties that had high or low age-adjusted mortality rates in at least four of seven 5-year periods. Note. Rates for Alaska and Hawaii were calculated, but they were not included in these analyses. Counties within 1 SD of the national average for 4 or more periods are shown in white. Counties with “high” mortality (black pattern) had mortality rates more than 1 SD greater than the US mean rate for at least 4 of the 7 (i.e., more than half) time periods. Counties with “low” mortality (black dotted pattern) had mortality rates more than 1 SD less than the US mean rate for at least 4 of the 7 time periods.
References
-
- Blanchard TC, Cossman JS, Levin ML. Multiple meanings of minority concentration: incorporating contextual explanations into the analysis of individual-level U.S. black mortality outcomes. Popul Res Policy Rev. 2004;23:309–326.
-
- LeClere FB, Rogers RG, Peters K. Neighborhood social context and racial differences in women’s heart disease mortality. J Health Soc Behav. 1998;39:91–107. - PubMed
-
- US Department of Health and Human Services. Compressed Mortality File. Hyattsville, Md: National Center for Health Statistics. Available at: http://www.cdc.gov/nchs/products/elec_prods/subject/mcompres.htm. Accessed April 10, 2006.
-
- James WL, Cossman RE, Cossman JS, Campbell C, Blanchard T. A brief visual primer for the mapping of mortality trend data. Int J Health Geogr. 2004;3:7. Available at: http://www.ij-healthgeographics.com/content/3/1/7. Accessed April 10, 2006. - PMC - PubMed
-
- Ormsby T, Napoleon E, Burke R, Groessl C, Feaster L. Getting to Know ArcGIS™ Desktop. Redlands, Calif: ESRI Press; 2001.
Publication types
MeSH terms
LinkOut - more resources
Full Text Sources
