. 2007 Jun;7(6):746-55.
doi: 10.1039/b705082h. Epub 2007 May 11.

Cell detection and counting through cell lysate impedance spectroscopy in microfluidic devices

Affiliations

Cell detection and counting through cell lysate impedance spectroscopy in microfluidic devices

Xuanhong Cheng et al. Lab Chip. 2007 Jun.

Abstract

Cell-based microfluidic devices have attracted interest for a wide range of applications. While optical cell counting and flow cytometry-type devices have been reported extensively, sensitive and efficient non-optical methods to detect and quantify cells attached over large surface areas within microdevices are generally lacking. We describe an electrical method for counting cells based on the measurement of changes in conductivity of the surrounding medium due to ions released from surface-immobilized cells within a microfluidic channel. Immobilized cells are lysed using a low conductivity, hypotonic media and the resulting change in impedance is measured using surface patterned electrodes to detect and quantify the number of cells. We found that the bulk solution conductance increases linearly with the number of isolated cells contributing to solution ion concentration. The method of cell lysate impedance spectroscopy is sensitive enough to detect 20 cells microL(-1), and offers a simple and efficient method for detecting and enumerating cells within microfluidic devices for many applications including measurement of CD4 cell counts in HIV patients in resource-limited settings. To our knowledge, this is the most sensitive approach using non-optical setups to enumerate immobilized cells. The microfluidic device, capable of isolating specific cell types from a complex bio-fluidic and quantifying cell number, can serve as a single use cartridge for a hand-held instrument to provide simple, fast and affordable cell counting in point-of-care settings.


Figures

Fig. 1
Fig. 1
Microfluidic devices and the experimental set up for impedance spectroscopy measurement. (a) Schematic drawing of the impedance measurement set up. Samples were delivered into the microchannels through an inlet (green) via a syringe pump, and impedance was measured using an LCR meter. (b) Illustration showing measurement of cell ion release using impedance spectroscopy. Target cells isolated within a microfluidic device are lysed to release intracellular ions. This leads to the increase of bulk conductance change, which can be monitored using surface patterned electrodes and impedance spectroscopy to detect cell numbers. Details of the electrode layout and device assembly are shown in (c)–(e): (c) interdigitated (IDT) co-planar electrodes, (d) simple two-rail co-planar electrodes and (e) top–bottom electrodes. The electrodes were patterned either on the bottom slides (for the IDT and two rail electrode designs) or on both slides (for the top–bottom electrode design) using standard cleanroom techniques and gold wet etching process. All devices were made by bonding two pieces of glass slide to 50 μm-thick PDMS gaskets (blue). Holes were drilled on the cover slides and assembled with PDMS ports to serve as sample inlets and outlets.
Fig. 2
Fig. 2
Impedance spectra and impedance change as a function of cell concentration using cell lysate obtained off-chip. (a) Impedance magnitude and (b) phase spectra of DI water and cell lysate with different starting cell concentrations measured on the IDT device. Three to five scans were performed at each cell concentration in the frequency range between 100 and 106 Hz. Impedance magnitude measured at 760 Hz is plotted in log–log scale as a function of cell concentration using (c) top–bottom electrodes, (d) IDT electrodes and (e) two rail electrodes. The solid dots in (c)–(e) are experimental measurements and they were fit to two-parameter power equations. The least square fits are shown as solid lines and equations in the graph. Error bars indicate the standard deviation from 3–5 continuous measurements within a single device.
Fig. 3
Fig. 3
Circuit model for fitting of the impedance spectra and extracted conductance as a function of cell concentration. (a) An equivalent circuit used in our study to model the electrode–electrolyte system for extracting bulk solution conductance, Rsol, which directly correlates with cell ion release. Representative fits of circuit to the complex impedance magnitude (b) and phase (c) spectra are plotted using off-chip cell lysate sample with a cell concentration of 3000 cells μL–1 in the IDT electrode chip. Crosses are the experimental data and solid lines show the fitting curves. From these fits, bulk conductance Rsol is extracted from spectra measured using (d) top–bottom electrodes, (e) IDT electrodes and (f) two-rail electrodes. Linear relationships between measured bulk solution conductance (solid dots) and cell concentration are observed using all electrode geometries and the best fit are shown as solid lines and equations in (d)–(f). Error bars in (d)–(f) indicates the standard deviation from 3–5 continuous measurements within a single device.
Fig. 4
Fig. 4
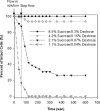
Percentage of viable cells as a function of time in different concentrations of low conductivity sugar solution observed under a fluorescence microscope. CD4+ T cells were captured in antibody-immobilized devices, followed with flowing in sugar solutions of different concentrations at 10 μL min–1 for 2 min. After the solution flow was stopped, cells were incubated at room temperature in this solution for 8 min and the number of intact cells was counted under a fluorescent microscope every 30 s. The percentage of intact cells was calculated by dividing the number of intact cells by the total number of cells before injection of each sugar solution.
Fig. 5
Fig. 5
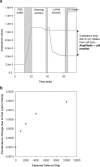
Impedance measurement at 760 Hz and conductance change in the process of on-chip cell lysis. (a) Impedance magnitude at 760 Hz during the process of cell capture and on-chip lysis. The respective incubation steps are labelled on top of the graph and the shaded areas between these labelled steps are transient states during solution exchanges. The impedance drop before and 10 min after injecting the lysing solution is associated with cell lysis and is used as a cell-numbers indicator. (b) Conductance change versus the number of cells captured within microfluidic devices. Bulk solution conductance was extracted from the impedance spectra, and conductance drop before and 10 min after flowing in the lysing solution was taken as the indicator to count cells. This conductance change increases proportionally with the number of cells captured within the microfluidic chip, suggesting immobilized cells can be counted by electrical measurement of their ion release. Nonlinearity of the relationship may arise from incomplete diffusion of ions within the measurement time. Each data point in the plot represents a measurement from one device.

References

    1. Qin JH, Ye NN, Liu X, Lin BC. Electrophoresis. 2005;26:3780–3788. - PubMed
    1. Yi CQ, Li CW, Ji SL, Yang MS. Anal. Chim. Acta. 2006;560:1–23.
    1. Andersson H, van den Berg A. Sens. Actuators, B. 2003;92:315–325.
    1. Fox MB, Esveld DC, Valero A, Luttge R, Mastwijk HC, Bartels PV, van den Berg A, Boom RM. Anal. Bioanal. Chem. 2006;385:474–485. - PubMed
    1. Andersson H, van den Berg A. Lab Chip. 2004;4:98–103. - PubMed

Publication types