

A multienzyme bioluminescent time-resolved pyrophosphate assay
- PMID: 17540325
- PMCID: PMC2737329
- DOI: 10.1016/j.ab.2007.04.023
A multienzyme bioluminescent time-resolved pyrophosphate assay
Abstract
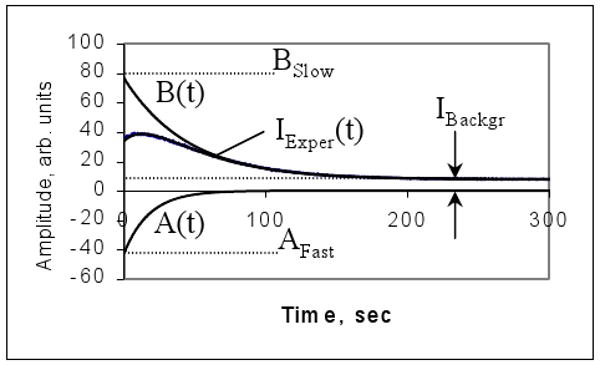
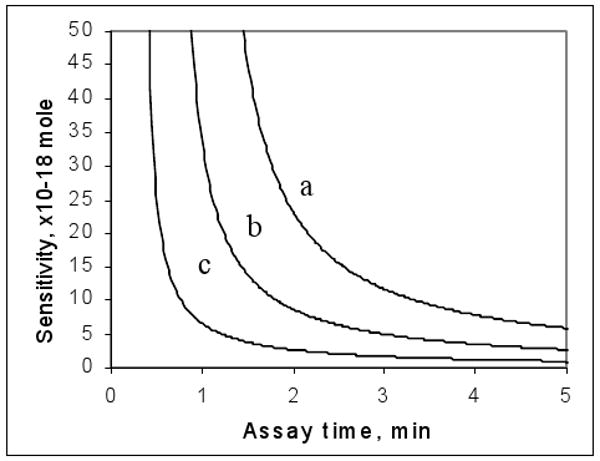
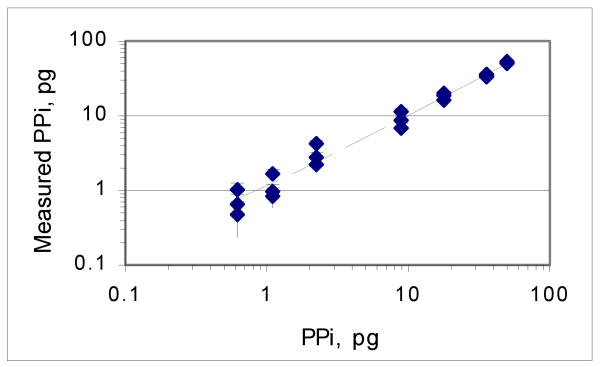
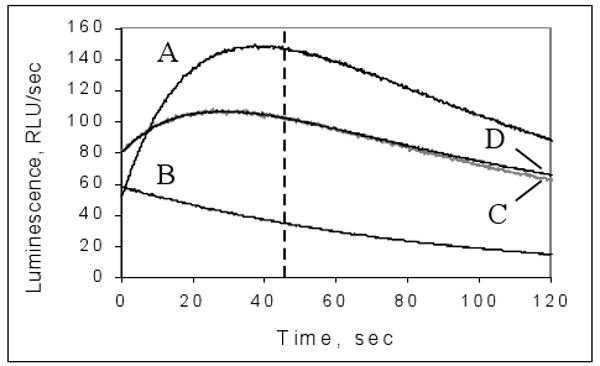
We have developed a high-sensitivity assay for measurement of inorganic pyrophosphate (PPi) in adenosine 5'-triphosphate (ATP)-contaminated samples. The assay is based on time-resolved measurements of the luminescence kinetics and implements multiple enzymes to convert PPi to ATP that is, in turn, utilized to produce light and to hydrolyze PPi for measurement of the steady state background luminescence. A theoretical model for describing luminescence kinetics and optimizing composition of the assay detection mixture is presented. We found that the model is in excellent agreement with the experimental results. We have developed and evaluated two algorithms for PPi measurement from luminescence kinetics acquired from ATP-contaminated samples. The first algorithm is considered to be the method of choice for analysis of long, i.e., 3-5 min, kinetics. The activity of enzymes is controlled during the experiment; the sensitivity of PPi detection is about 7 pg/ml or 15 pM of PPi in ATP-contaminated samples. The second algorithm is designed for analysis of short, i.e., less than 1-min, luminescence kinetics. It has about 20 pM PPi detection sensitivity and may be the better choice for assays in microplate format, where a short measurement time is required. The PPi assay is primarily developed for RNA expression analysis, but it also can be used in various applications that require high-sensitivity PPi detection in ATP-contaminated samples.
Figures


References
-
- Sun Y, Golovlev V. Bioluminescence assay for RNA quantitation. Luminescence. 2006;21:293.
-
- Hassibi A, Lee TH, Davis RW, Pourmand N. Bioluminescence regenerative cycle (BRC) system for nucleic acid quantification assays, Microarrays and Combinatorial Technologies for Biomedical Applications: Design, Fabrication, and Analysis. Poceedings of SPIE. 2003;4966:65–75.
-
- Sun Y, Jacobson KB, Golovlev V. Quantitative bioluminescent RNA assay. Proceedings of 14th International Symposium on Bioluminescence and Chemiluminescence; San Diego CA. 2006. in press.
-
- Brovko L, Gandel'man O, Polenova T, Ugarova N. Kinetics of bioluminescence in the firefly luciferin-luciferase system. Biochem (Moscow) 1994;59:195–201.
Publication types
MeSH terms
Substances
Grants and funding
LinkOut - more resources
Full Text Sources
