. 2007 Jun 29;147(2):532-45.
doi: 10.1016/j.neuroscience.2007.04.031. Epub 2007 May 31.

Reorganization of receptive fields following hearing loss in inferior colliculus neurons

Affiliations

Reorganization of receptive fields following hearing loss in inferior colliculus neurons

K Barsz et al. Neuroscience. .

Abstract

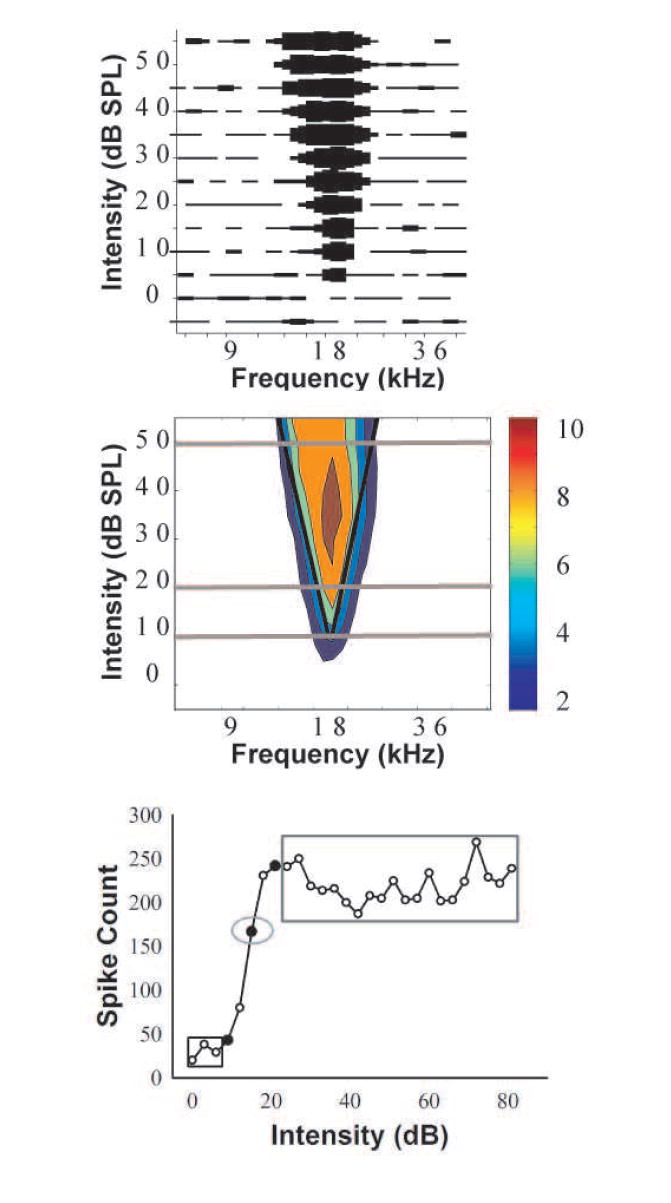
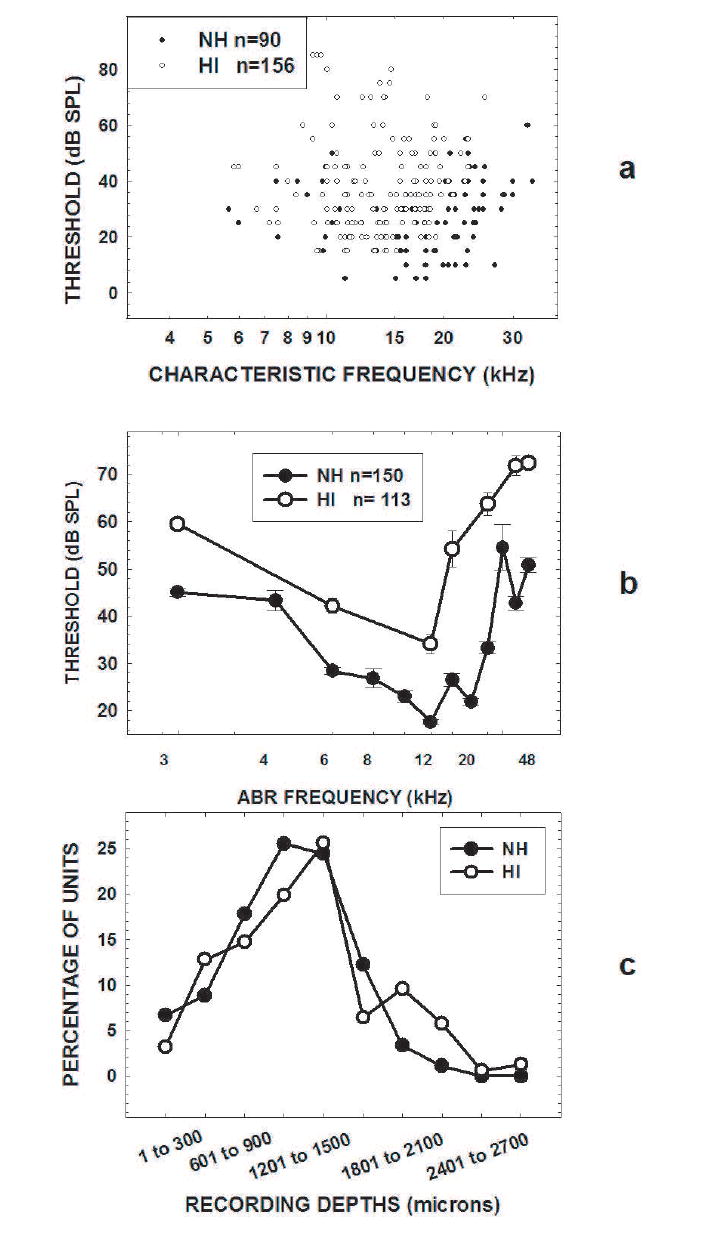
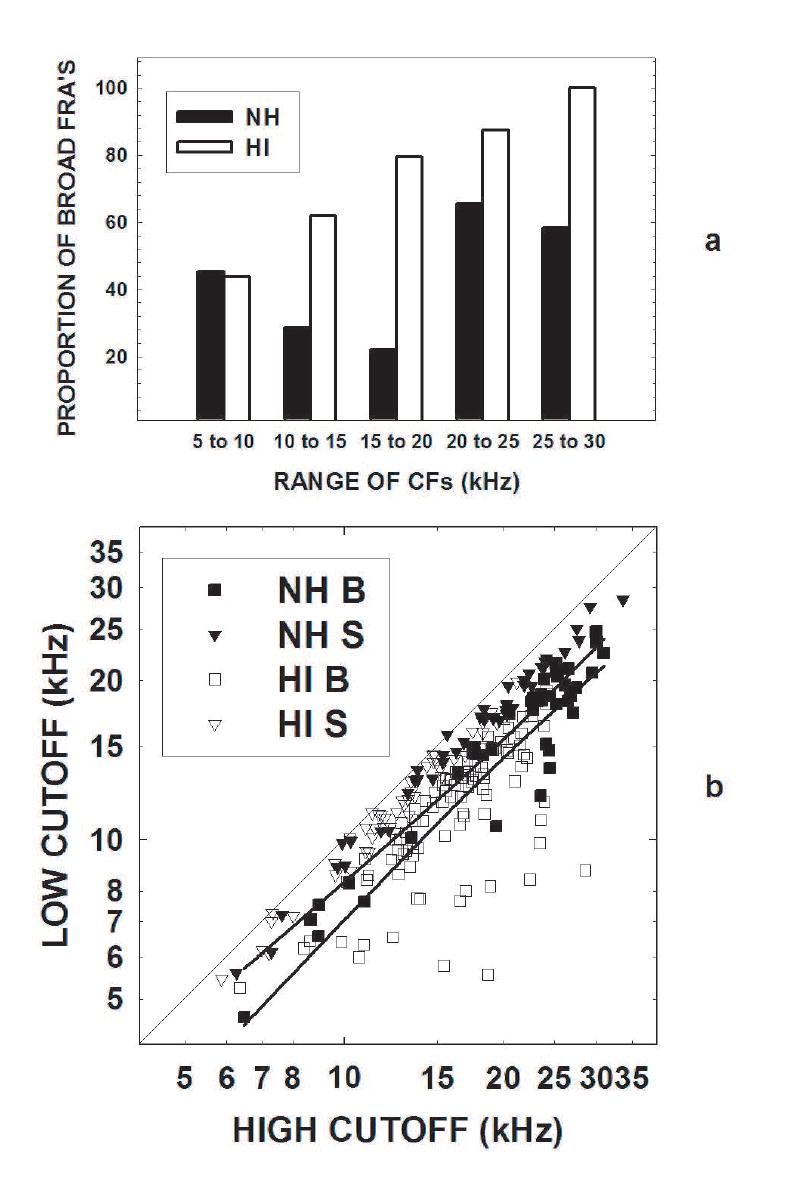
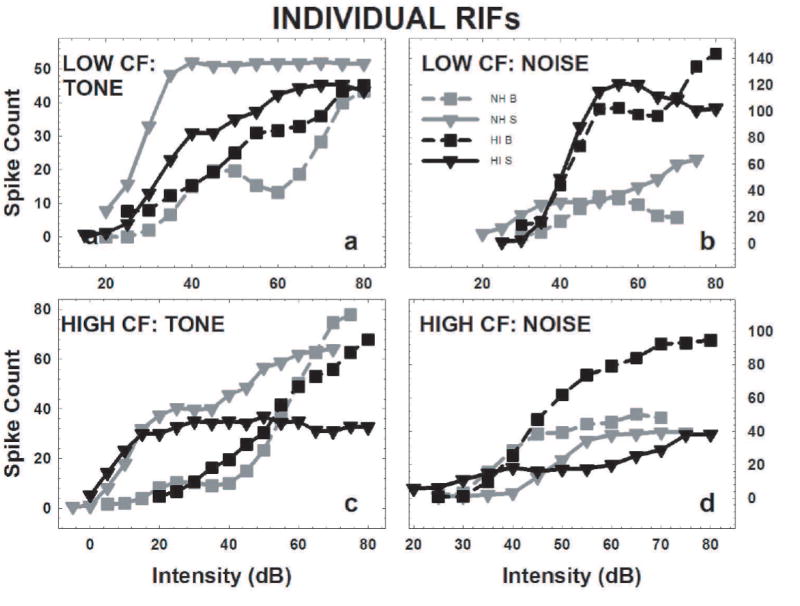
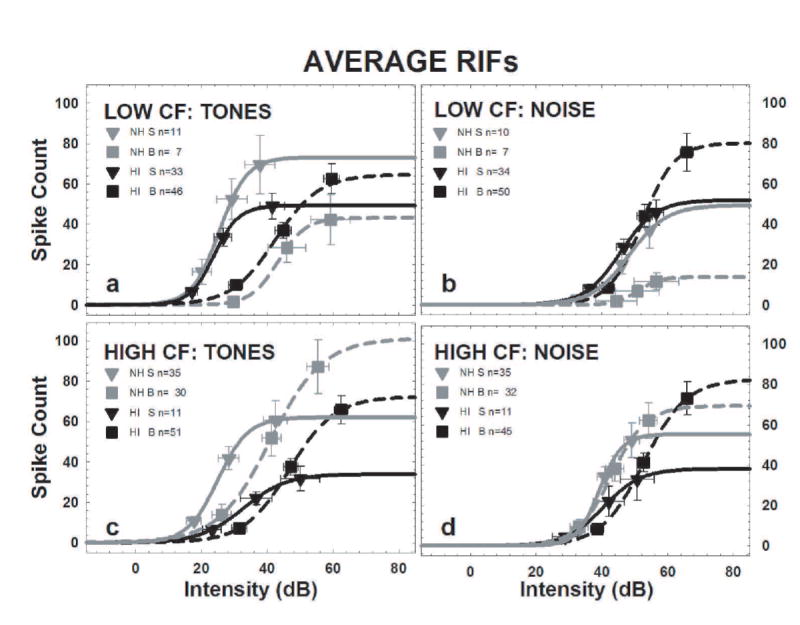
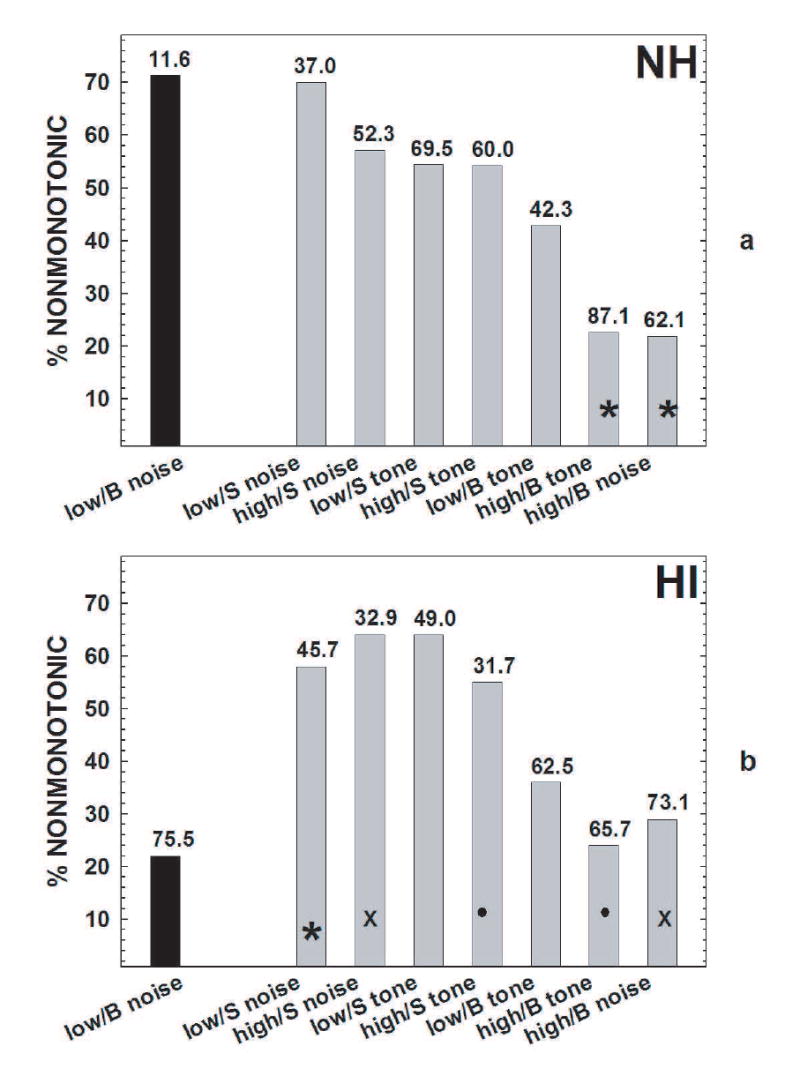
We explored frequency and intensity encoding in the inferior colliculus (IC) of the C57 mouse model of sensorineural hearing loss. Consistent with plasticity reported in the IC of other models of hearing loss, frequency response areas (FRAs) in hearing-impaired (HI) mice were broader with fewer high-frequency units than normal-hearing (NH) mice. The broad FRAs recorded from HI mice had lower cutoffs on the low frequency edge of the FRA. Characteristic frequency (CF) and sharpness of tuning (Q10) calculated from the FRA were used to divide the sample into four categories: low-CF sharp-FRA, low-CF broad-FRA, high-CF sharp-FRA, and high-CF broad-FRA units. Rate-intensity functions (RIFs) for CF tones and noise were used to determine the minimum and maximum response counts as well as the sound pressure levels resulting in 10%, 50%, and 90% of the maximum spike count. Tone RIFs of broad FRA units were shifted to the right of tone RIFs of sharp FRA units in both NH and HI mouse IC, regardless of the unit CF. The main effects of hearing loss were seen in the noise RIFs. The low-CF broad-FRA units in HI mice had elevated responses to noise, and the high-CF sharp-FRA units in HI mice had lower maximum rates, as compared with the units recorded from NH mice. These results suggest that, as the IC responds to peripheral hearing loss with changes in the representation of frequency, an altered balance between inhibitory and excitatory inputs to the neurons recorded from the HI mice alters aspects of the units' intensity encoding. This altered balance likely occurs, at least in part, outside of the IC.


Figures

Fig. 1
Fig. 1
a) This is the raw FRA of an IC unit from a 2-mo-old NH C57 mouse. Driven activity is depicted by the thickness of the line at each frequency/intensity combination, and narrower lines indicate fewer spikes. In this example, the thickest bar represents 12 spikes. b) The smoothed FRA following automated analysis (see Methods) with the number of spikes indicated by color (color bar legend is shown to the right, and the maximum smoothed spike count is 10). The black lines indicate the best fit regression through the low- and high- frequency cutoffs, and define the driven response. These lines intersect at the CF. The gray lines denote the intensities representing the threshold, 10 dB above threshold, and 40 dB above threshold, and are extended beyond the FRA in order to increase their visibility. c) A sample RIF demonstrating the 3 intensity and 3 count measures obtained from each neuron. The 10% intensity is indicated by the leftmost filled circle, and the counts elicited by each of the three intensities below the 10% intensity, enclosed by the black rectangle, are averaged for the minimum count. The 50% intensity is indicated by the middle filled circle, and the spike count elicited by this intensity, enclosed by the gray oval, is the 50% count. The 90% intensity is indicated by the filled circle to the left of the 50% intensity. The counts elicited by each of the 20 intensities that were greater than the 90% intensity are enclosed by the gray rectangle, and these were averaged to yield the maximum count.
Fig. 2
Fig. 2
a) The scatter plot shows the CF and threshold of each unit included in the analysis. The filled circles represent units recorded from NH mice and open circles represent those recorded from HI mice. The CFs have been jittered to separate the points as much as possible. Note that fewer high-CF units were recorded from HI mice. b) Mean ABR thresholds (with standard error bars) for the 150 21-64 day old (NH, filled circles) mice and the 113 182-301 day old (HI, open circles) C57 mice in our colony. These thresholds are consistent with the single unit CF tone thresholds in Fig. 2a. Note that some standard errors bars are so small that they are covered by the symbols. c) Proportions of units recorded at different depths (300-μm bins) from NH mice (filled circles) and HI mice (open circles) do not differ systematically.
Fig. 3
Fig. 3
a) This bar graph shows the percentage of broad FRAs in 5 kHz-wide frequency bins from 5 to 30 kHz (solid bars for the NH mice, open bars for the HI mice). Note that the proportion of broad FRAs was greater in HI mice than in NH mice above 10 kHz. b) In order to show the effect of hearing loss on the relationship between the low- and high-frequency FRA cutoffs measured 10 dB above threshold, the cutoffs for each unit are plotted for the NH (closed symbols) and HI (open symbols) units. Sharp (S) units are plotted as inverted triangles and broad (B) units as squares. The solid lines indicate the 95% intervals around the regression line (all data, regression line not shown). If the cutoffs were equal, the data points would fall on the diagonal (gray dashed reference line). Instead, the low frequency cutoffs are typically lower than the high frequency cutoff, so that the data points fall below the line. The smallest difference between the cutoffs is 39.1 (for an HI unit); two other units had small differences: 48.6 (an NH unit) and 49.7 (an HI unit)However, the data points of the broad units recorded from the HI mice extend much further below the diagonal than data points recorded from the NH mice, and many fall below the 95% interval. This occurred because, for any given high frequency cutoff, the low frequency cutoffs are often lowest for the HI broad FRAs.
Fig. 4
Fig. 4
The RIFs of 8 NH units and 8 HI units illustrate how units in each CF/FRA category responded to CF tones and noise bursts that varied in intensity. Each of these RIFs was smoothed using a 3 intensity moving average in the same manner as the rest of the RIFs in the sample. The RIFs for the units with sharp (S) FRAs were displayed using inverted triangles, with the solid lines representing the fitted functions. Broad (B) FRAs are indicated by squares and dashed lines. RIFs obtained from NH IC are in gray, and RIFs obtained from HI IC are in black. The spike count tick labels were included on the right for ease of reading. a) The low/broad units’ tone-RIFs are shifted to the right of the low/sharp units’ tone-RIFs for both the NH and HI units. b) The NH low/broad units’ noise-RIF has the lowest response of any noise-RIF in this category. c) These high-CF tone-RIFs resemble those of the low CF units. d) The HI high/broad unit had the strongest noise response of the high-CF units shown here, and the noise-RIF of the NH high/sharp unit lay farthest to the right.
Fig. 5
Fig. 5
These average RIFs represent the central tendency of all the units in each CF/FRA category for the NH and the HI data. Each average RIF was constructed by plotting the count and intensity value at which the mean data, averaged for all units within the category, reached the 10%, 50%, and 90% points, and fitting those data points with a sigmoid function. Averages were calculated separately for NH and HI data, broad and sharp RIFs, and for CF tone and noise RIFs. The spike count tick labels were included on the right for ease of reading. The means for the units with sharp FRAs (S) were displayed using inverted triangles, with the solid lines representing the fitted functions. Broad FRAs (B) are indicated by squares and dashed lines. RIFs obtained from NH IC are in gray, and RIFs obtained from HI IC are in black. The minimum and maximum counts are themselves averages as described in the methods. a) The tone RIFs of the low/broad units RIFs were shifted to the right of the tone RIFs of the low/sharp units. There were no differences between the NH and HI mice and no systematic differences in the spike counts. b) The noise RIFs of NH low/broad units have striking low 50% and maximum spike counts. c) The tone RIFs of the high-CF units resemble those of the low-CF units. d) The noise RIFs of the HI high/broad units shifted to right of the HI high/sharp RIFs but the NH high/sharp RIFs were not shifted relative to the NH high/broad RIFs. The HI high/sharp RIFs had lower 50% and maximum counts than the other high CF noise RIFs. Note that, because of the hearing loss, there are more low frequency CFs in the HI mice.
Fig. 6
Fig. 6
a) The proportion of nonmonotonic units for noise RIFs from low/broad units is indicated by the black bar. The gray bars show the proportion of nonmonotonic units in each of the other CF/FRA categories (low/sharp noise RIFs, high/sharp noise RIFs, low/sharp tone RIFs, high/sharp tone RIFs, low/broad tone RIFs, high/broad tone RIFs, and high/broad noise RIFs), ordered in descending proportions. The number above each bar is the mean maximum count in that category. The asterisks indicate the categories with proportions that are significantly different from the black bar (p<.05). Note that the low-CFs broad-FRA units (black bar) had a high proportion of nonmonotonic units and the lowest maximum count. b) The proportion of nonmonotonic units in the noise RIFs produced by low/broad units is indicated by the black bar. This proportion was significantly lower than among noise RIFs produced by low/sharp units, as indicated by the gray bar with the asterisk. The other gray bars show the proportion of nonmonotonic units in each of the other categories, ordered as in Fig. 6a. Among high-CF units, the sharp-FRA units had more nonmonotonic noise-RIFs (the gray bars marked by X’s) and tone-RIFs (the gray bars marked by filled circles) than the broad-FRA units. As in Fig. 6a, the numbers above the bars are the mean maximum counts in each category. Again, the rollover coefficient decreased (more nonmonotonic) with the maximum count.

Similar articles

Cited by

References

    1. Aitkin L, Tran L, Syka J. The responses of neurons in subdivisions of the inferior colliculus of cats to tonal, noise and vocal stimuli. Exp Brain Res. 1994;98:53–64. - PubMed
    1. Alkhatib A, Biebel UW, Smolders JW. Inhibitory and excitatory response areas of neurons in the central nucleus of the inferior colliculus in unanesthetized chinchillas. Exp Brain Res. 2006;174:124–143. - PubMed
    1. Barsz K, Benson PK, Walton JP. Gap encoding by inferior collicular neurons is altered by minimal changes in signal envelope. Hear Res. 1998;115:13–26. - PubMed
    1. Caspary DM, Holder TM, Hughes LF, Milbrandt JC, McKernan RM, Naritoku DK. Age-related changes in GABA(A) receptor subunit composition and function in rat auditory system. Neuroscience. 1999;93:307–312. - PubMed
    1. Caspary DM, Milbrandt JC, Helfert RH. Central auditory aging: GABA changes in the inferior colliculus. Exp Gerontol. 1995;30:349–360. - PubMed

Publication types