Review
. 2007 Jul;3(4):413-38.
doi: 10.1016/j.actbio.2007.04.002. Epub 2007 May 30.

Biomechanics and biophysics of cancer cells

Affiliations
Review

Biomechanics and biophysics of cancer cells

Subra Suresh. Acta Biomater. 2007 Jul.

Abstract

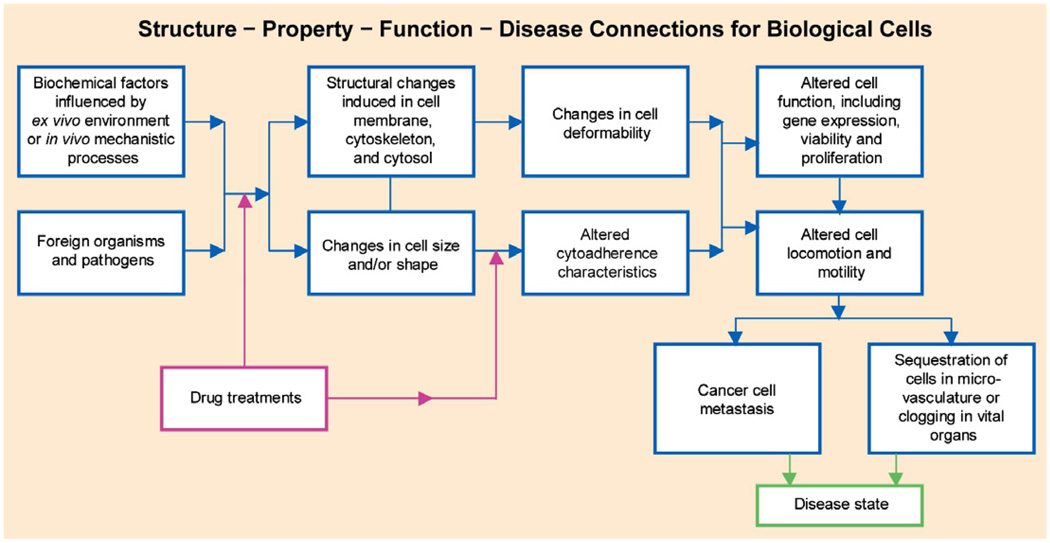
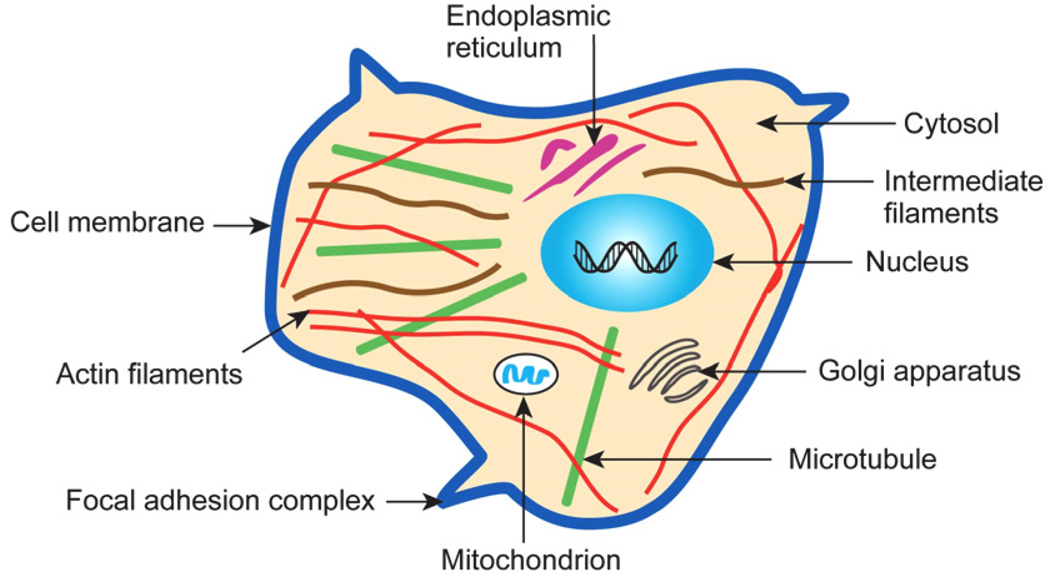
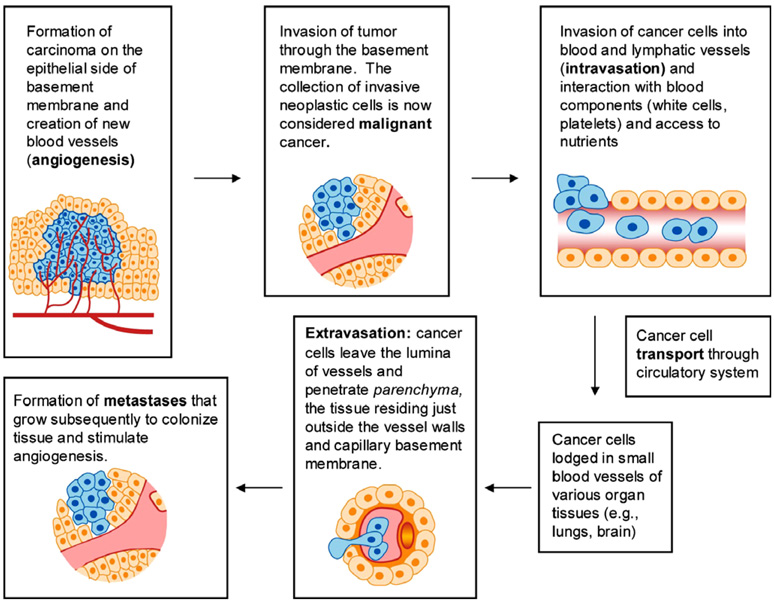
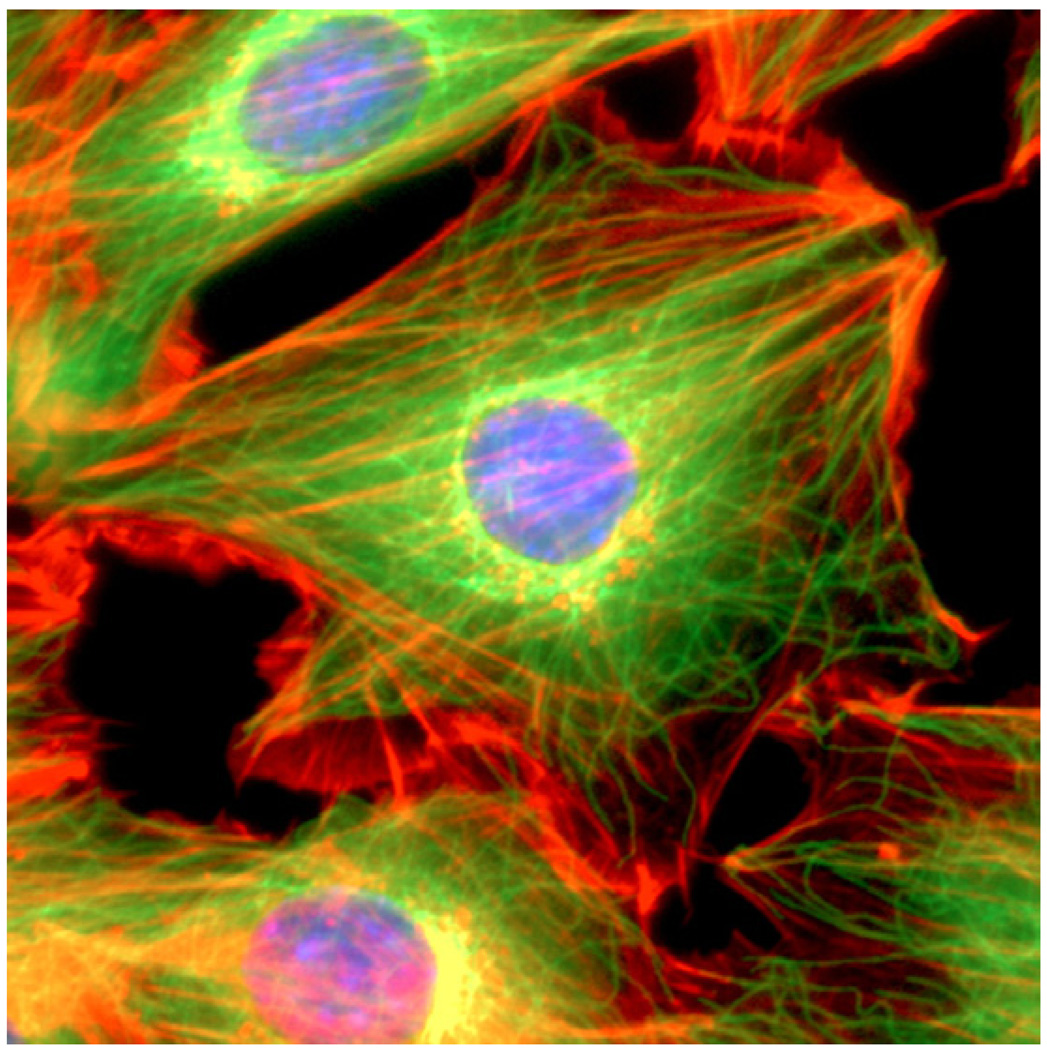
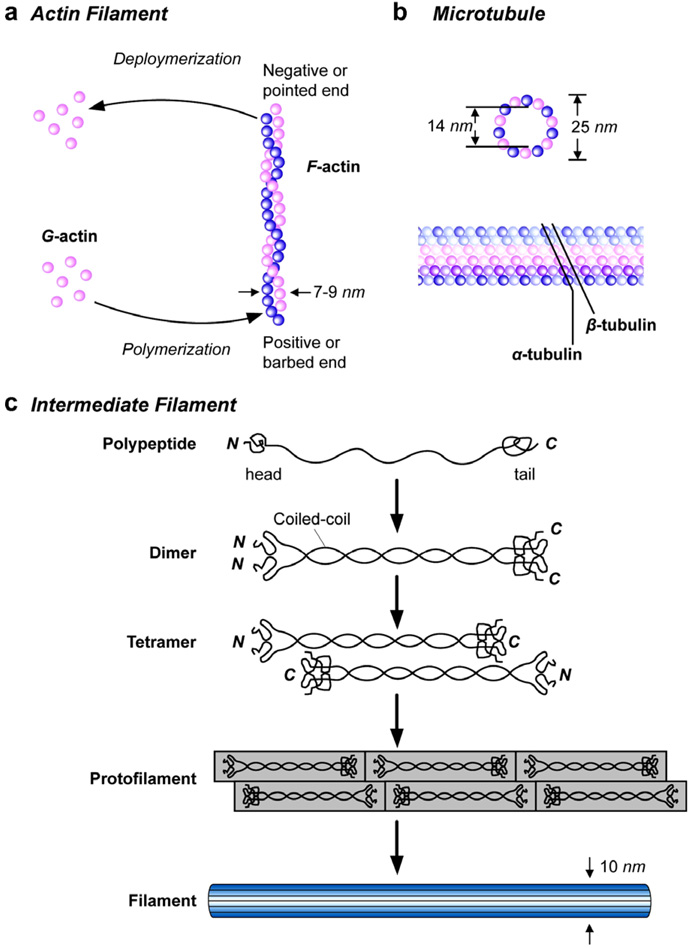
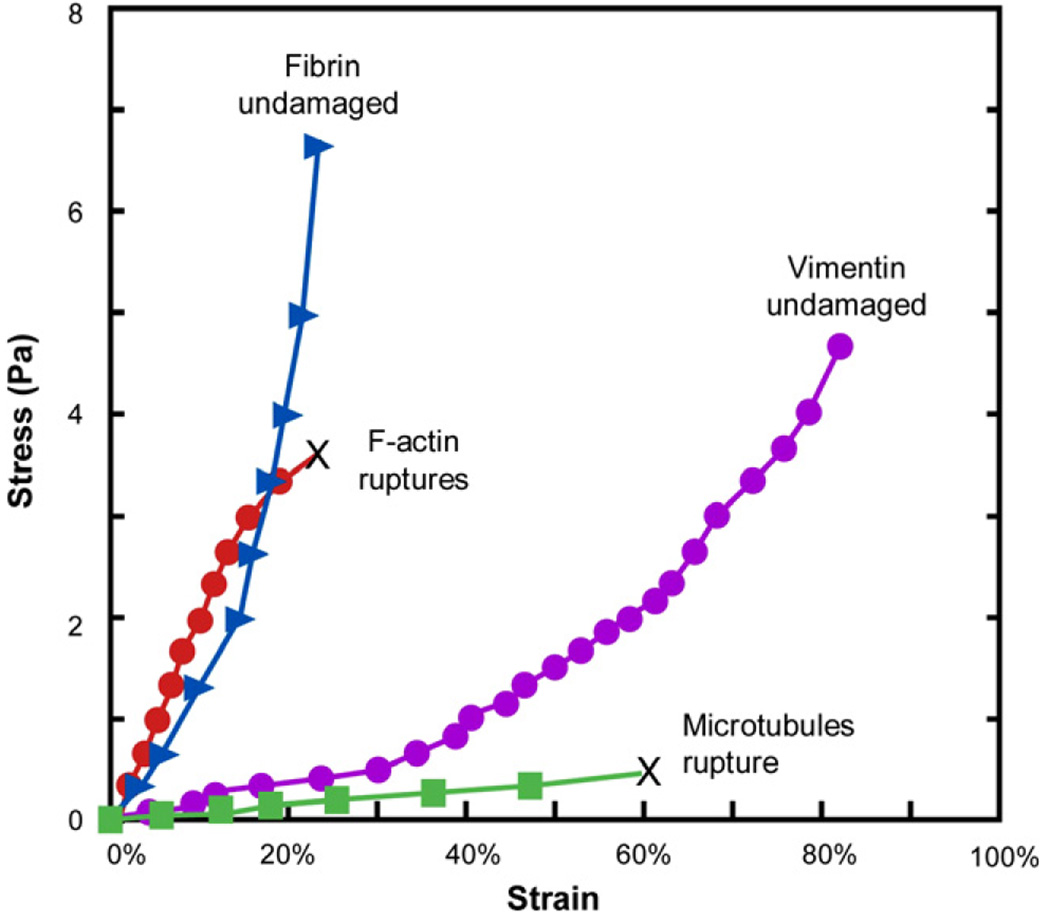
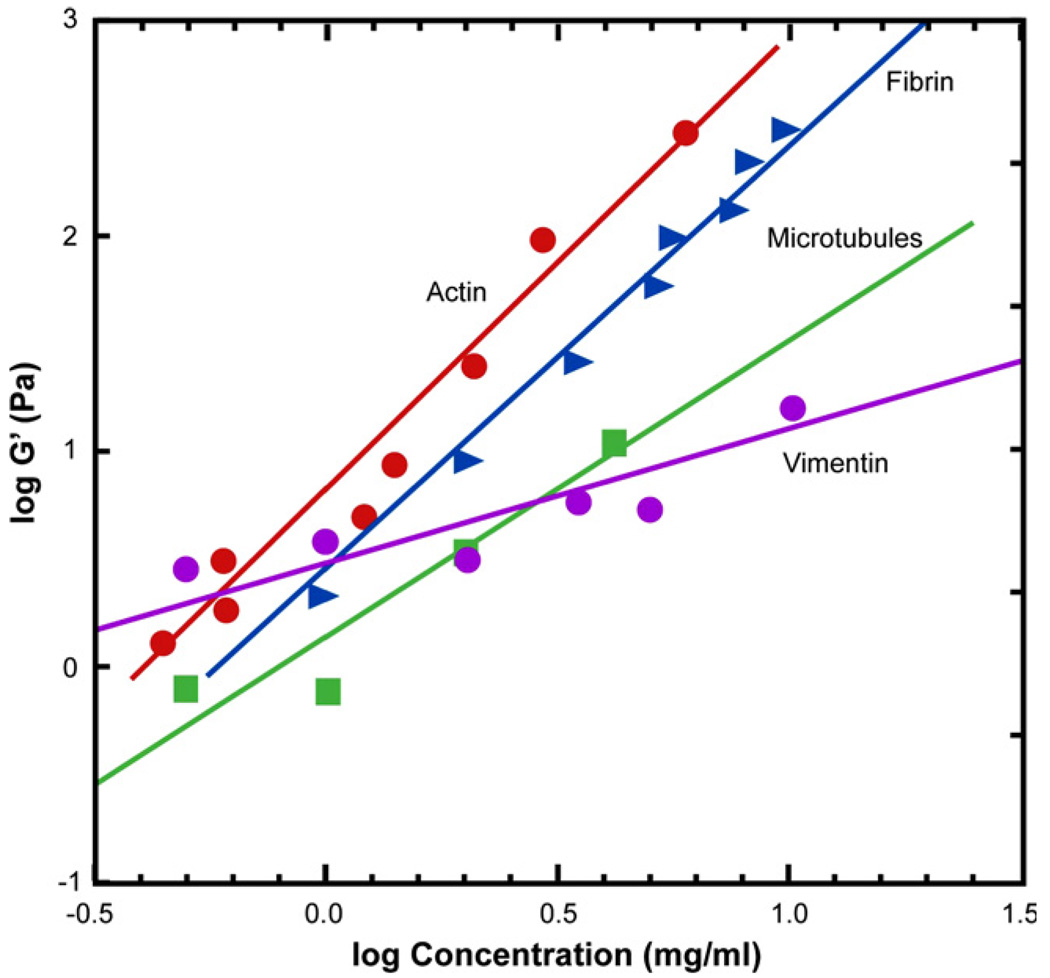
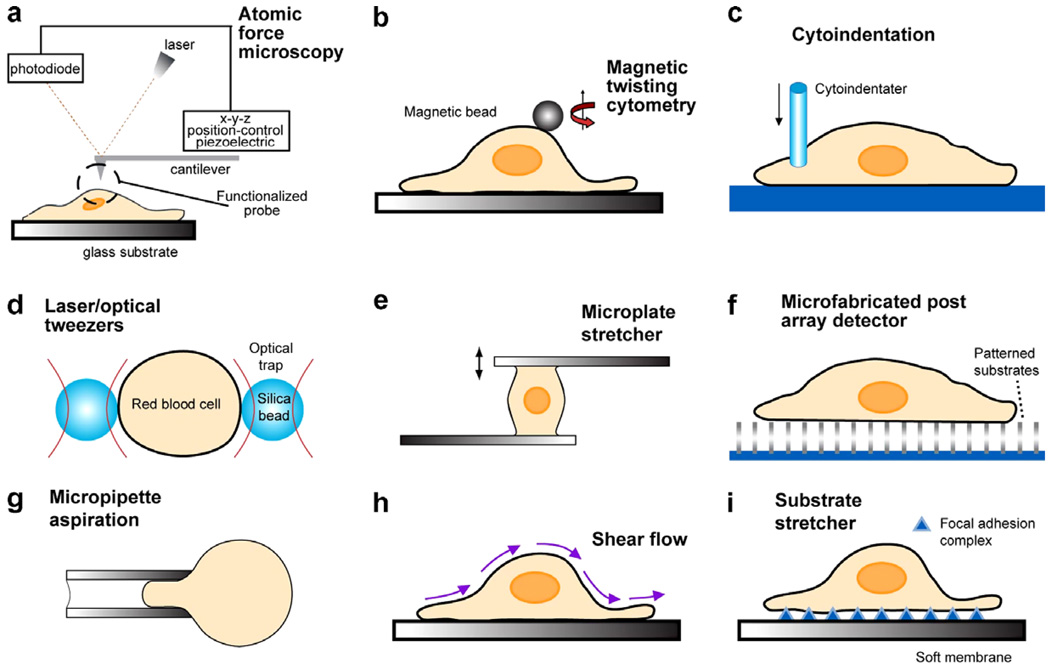
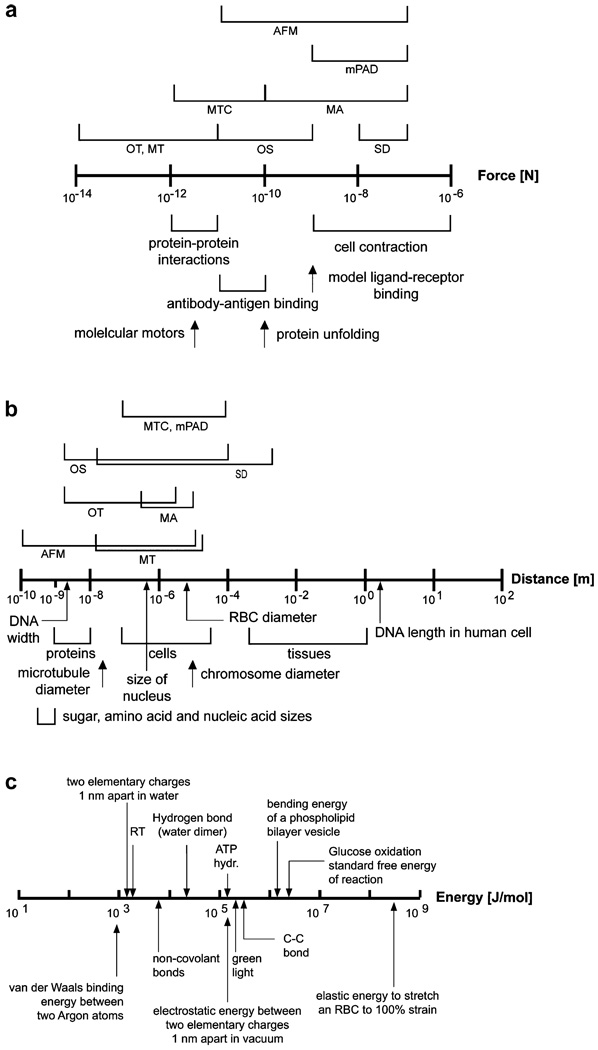
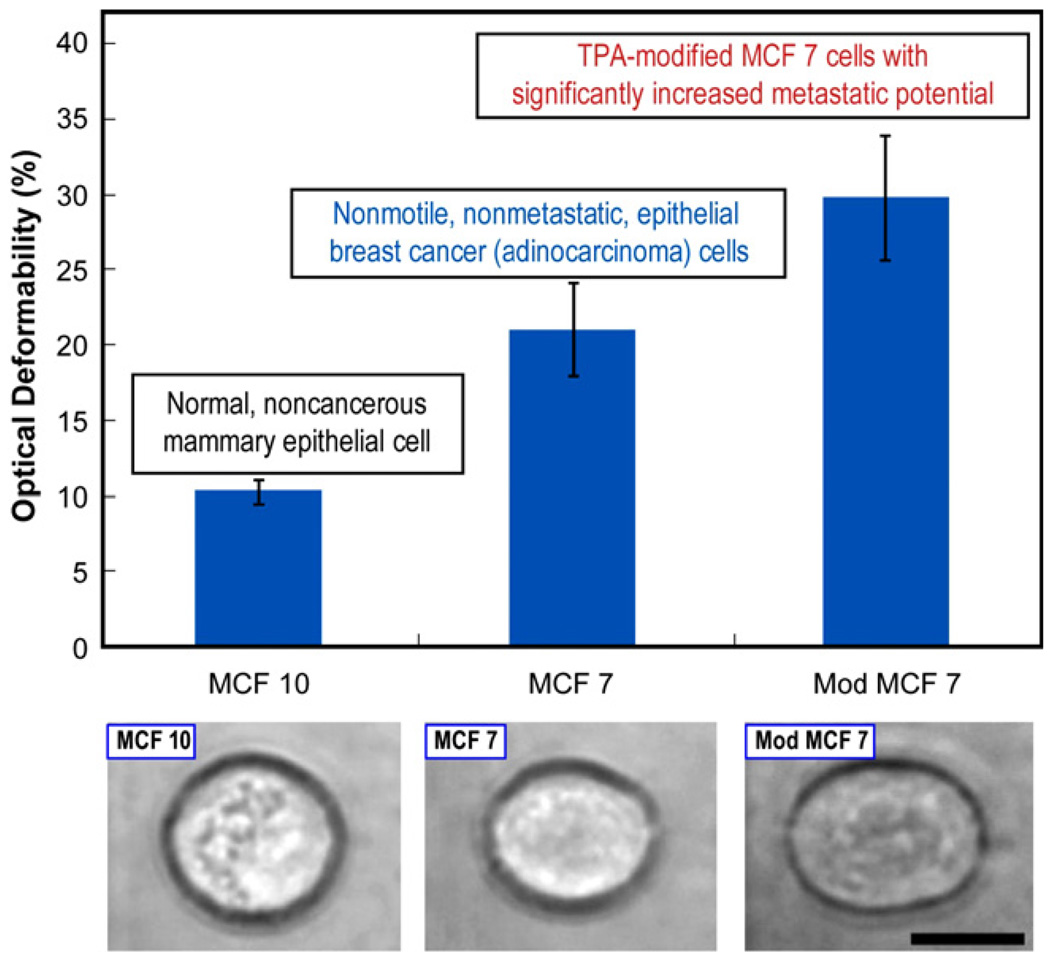
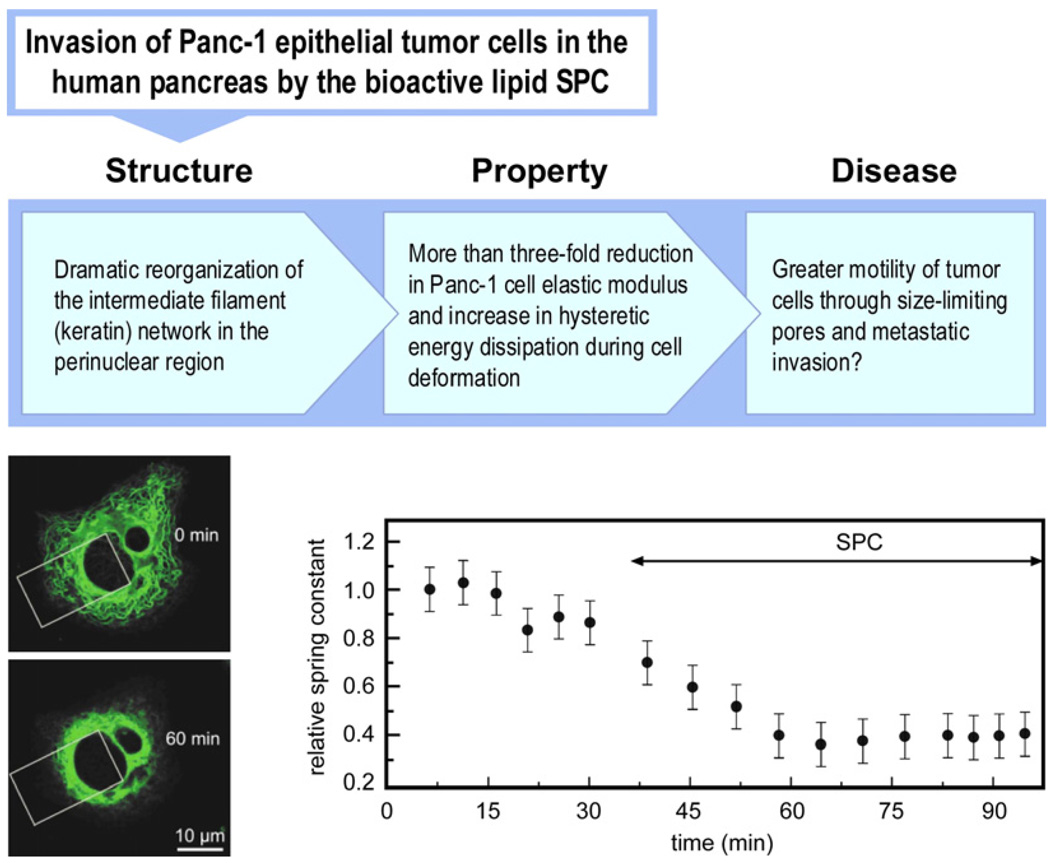
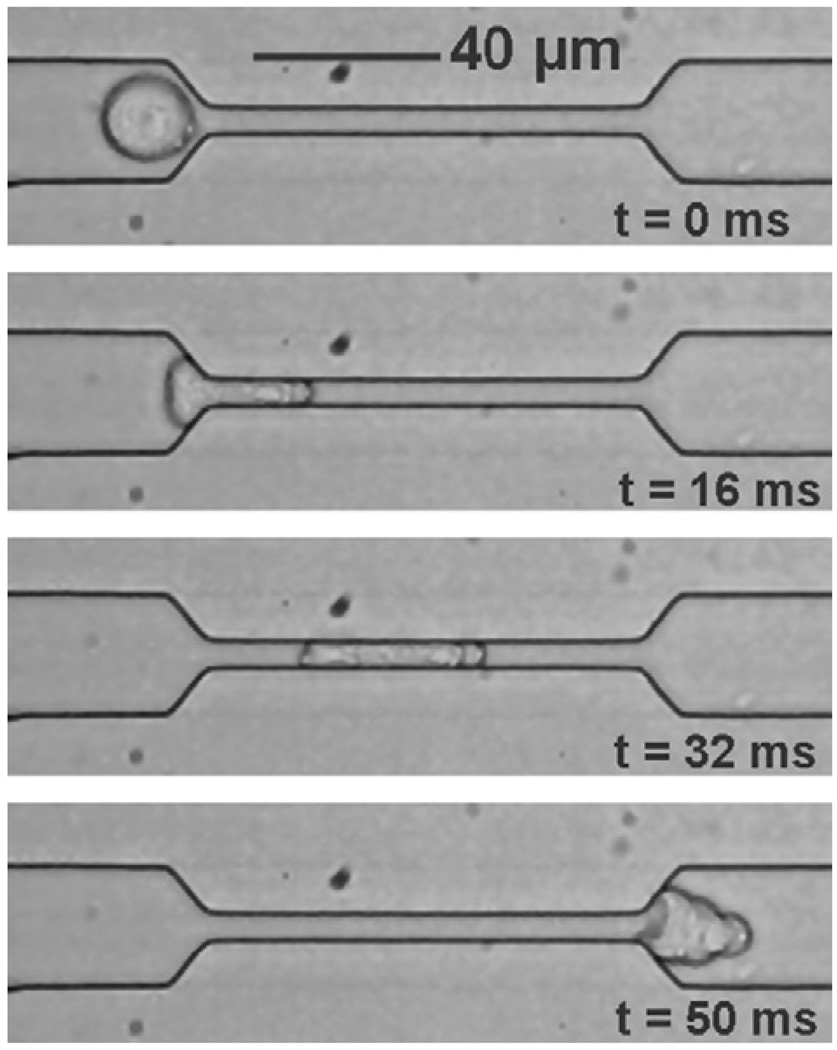
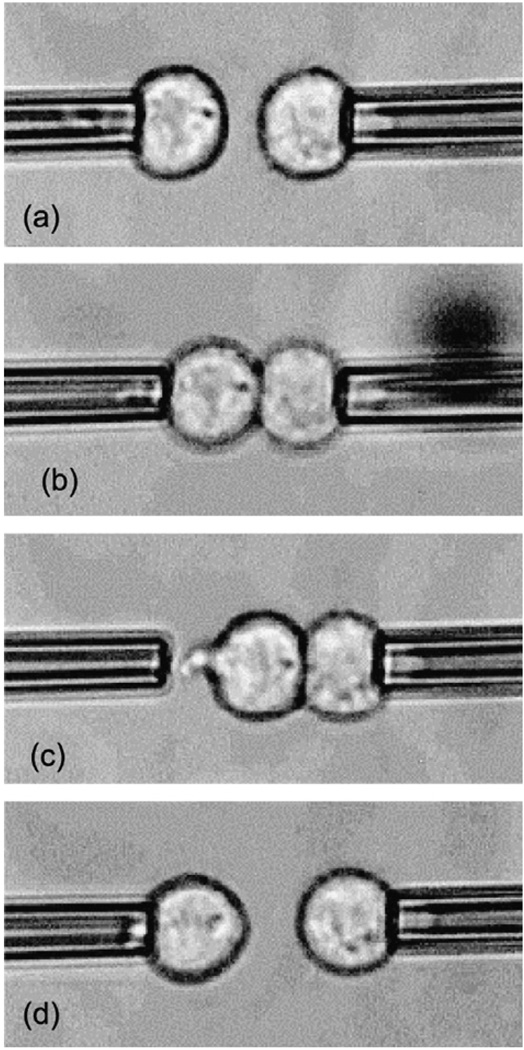
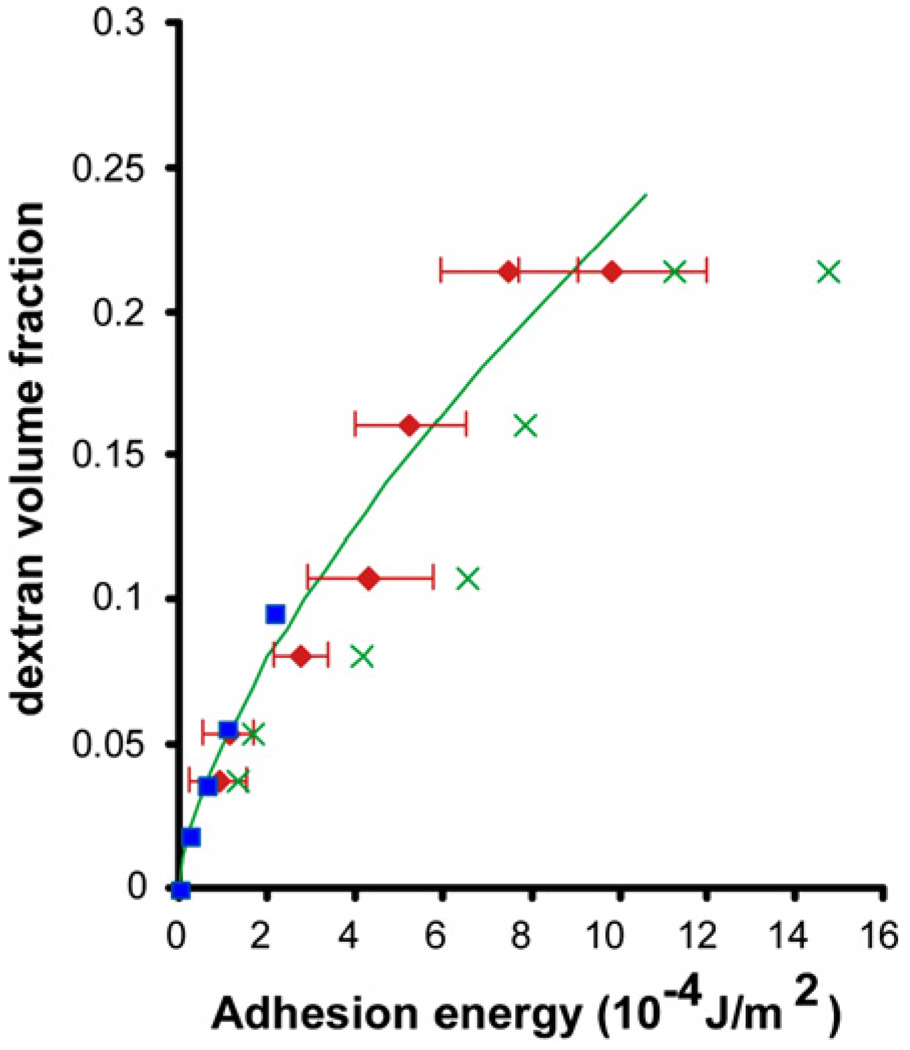
The past decade has seen substantial growth in research into how changes in the biomechanical and biophysical properties of cells and subcellular structures influence, and are influenced by, the onset and progression of human diseases. This paper presents an overview of the rapidly expanding, nascent field of research that deals with the biomechanics and biophysics of cancer cells. The review begins with some key observations on the biology of cancer cells and on the role of actin microfilaments, intermediate filaments and microtubule biopolymer cytoskeletal components in influencing cell mechanics, locomotion, differentiation and neoplastic transformation. In order to set the scene for mechanistic discussions of the connections among alterations to subcellular structures, attendant changes in cell deformability, cytoadherence, migration, invasion and tumor metastasis, a survey is presented of the various quantitative mechanical and physical assays to extract the elastic and viscoelastic deformability of cancer cells. Results available in the literature on cell mechanics for different types of cancer are then reviewed. Representative case studies are presented next to illustrate how chemically induced cytoskeletal changes, biomechanical responses and signals from the intracellular regions act in concert with the chemomechanical environment of the extracellular matrix and the molecular tumorigenic signaling pathways to effect malignant transformations. Results are presented to illustrate how changes to cytoskeletal architecture induced by cancer drugs and chemotherapy regimens can significantly influence cell mechanics and disease state. It is reasoned through experimental evidence that greater understanding of the mechanics of cancer cell deformability and its interactions with the extracellular physical, chemical and biological environments offers enormous potential for significant new developments in disease diagnostics, prophylactics, therapeutics and drug efficacy assays.


Figures

Fig. 1
Fig. 1
Schematic of chemobiomechanical pathways influencing connections among subcellular structure, cell biomechanics, motility and disease state.
Fig. 2
Fig. 2
Schematic illustration of the subcellular structure of a typical eukaryotic cell. Adapted with modifications from Ref. [13]. The structure of key cytoskeletal components is discussed in detail in Section 3.
Fig. 3
Fig. 3
Annual cancer death rates among males, age-adjusted to the standard population of the USA in the year 2000, over the period 1930–2001. Adapted from Ref. [76].
Fig. 4
Fig. 4
Annual cancer death rates among females, age-adjusted to the standard population of the USA in the year 2000, over the period 1930–2001. Adapted from Ref. [76].
Fig. 5
Fig. 5
Various steps involved in the cancer cell invasion-metastasis cascade. Adapted with modifications from [77].
Fig. 6
Fig. 6
A mouse NIH3T3 fibroblast cell was fixed and stained for DNA (blue) and the major cytoskeletal filaments actin (red) and alpha-tubulin (green). The cell was imaged by fluorescence microscopy on an optical IX70 microscope with a deep-cooled CCD camera. Image courtesy of and with permission from Andrew E. Pelling (London Centre for Nanotechnology and Department of Medicine, University College London).
Fig. 7
Fig. 7
Schematic illustrations of the structures of the three basic components of the cytoskeleton of eukaryotic cells. Adapted from [83].
Fig. 8
Fig. 8
Stress–strain curves of actin, vimentin, tubulin and fibrin for which the data points were obtained by monitoring strains at 30 s after the imposition of the shear stress. The concentration of each sample was 2 mg ml−1. F-actin and vimentin networks “rupture” by flowing like a liquid at the value of strain indicated by the symbol “X”. Adapted and replotted from Ref. [88].
Fig. 9
Fig. 9
A plot of the storage modulus of the four biopolymers, actin, vimentin, tubulin and fibrin, as a function of their protein concentrations, plotted on a log–log scale. Adapted from Ref. [88].
Fig. 10
Fig. 10
Schematic illustrations of the biomechanical assays used to probe subcellular regions are given in (a)–(c). Biophysical assays commonly used to probe the deformation of single cells are illustrated in (d)–(g). Techniques used to infer cytoadherence, deformation and mobility characteristics of populations of cells are schematically sketched in (h) and (i). This figure is adapted with modifications from Ref. [13].
Fig. 11
Fig. 11
Force scales (a) and length scales (b) of relevance to cell and molecular biomechanics. The ranges of forces and displacements probed by different biomechanical assays are also indicated in these two figures. (c) Some energy scales of relevance to biological systems and processes.
Fig. 12
Fig. 12
Relative cell stiffness, as characterized by optical deformability, of healthy (MCF 10) and malignant (MCF 7) human breast cancer epithelial cells (top figure). Also shown in the top figure is a malignant mammary epithelial cell chemically modified to increase its metastatic potential. The optical images of the three cases at the bottom shows an increase in deformability for the cancerous MCF 7 cell compared with the nonmalignant MCF 10, and a further increase in deformability for the Mod MCF 7 cell. These images correspond to a constant stretching laser power of 600 mW. The black scale bar is 10 µm. Adapted from Guck et al. [129]. Reprinted with permission.
Fig. 13
Fig. 13
Possible structure–biomechanics–disease connections in the migration and metastatic efficiency of human Panc-1 epithelial tumor cells. The lower left optical immunofluorescence images were taken using an inverted confocal microscope with a stage pre-heated to 37 °C over a period of 60 min. The top image shows the Panc-1 cancer cell (with two nuclei). When the cell is transfected with 0.5 µg ml−1 of C-HK18-EYFPN1 using Fugene (Roche) and kept in dye-free Dulbecco’s modified Eagle’s medium (20 mM HEPES) in the presence of 10 µM SPC, the keratin network collapses around the nucleus, as shown in the bottom left image. Note the significant reduction, due to SPC treatment, in the spatial distribution of the keratin filaments within the white rectangular area. Microplate mechanical stretch test results of the variation of the effective spring constant of the Panc-1 cell as a function of time before and after SPC treatment. The optical images and biomechanical results are reproduced with permission from Ref. [71].
Fig. 14
Fig. 14
A series of sequential optical micrographs showing the movement of a human Panc-1 cancer cell through a PDMS microfabricated fluidic channel, the pressure gradient across which was controlled. The cell approaches the constriction in at a flow rate of ~0.5 µl min−1 (t = 0 ms) and is forced to squeeze into a 9 µm × 18 µm × 150 µm constriction of a PDMS microchannel (t = 16 ms) over a pressure gradient of 4 kPa. After moving through the channel, shape recovery occurs (t = 50 ms). Micrograph obtained by Walter in the laboratory of the author.
Fig. 15
Fig. 15
The energy of adhesion between two murine sarcoma S180 cells quantified using micropipette aspiration, for different concentrations of the suspending medium dextran. (a) The cells, aspirated through weak pressure with micropipettes, are brought into contact and (b) adhere after 1 s of contact. The aspiration pressure of the right micropipette is then strengthened, and that pipette is moved to the right. As a result, the left cell, tightly adhered to the right cell, leaves the left micropipette, as in (c), or the two cells separate, as in (d). In the case of the behavior shown in (c), the left cell is recaptured by the pipette, aspirated and the right pipette displaced. This process is repeated until the cells separate, and the cell separation force is extracted from the final aspiration pressures. Reproduced with permission from Chu et al. [44].
Fig. 16
Fig. 16
Values of adhesion energy between dextran-treated S180 sarcoma cells from micropipette experiments (red points) using Eqs. (3) and (4). The green line shows theoretical predictions of the attractive forces on phospholipids bilayers due to the depletion of dextran, Eq. (5). The predictions of Eq. (6) are shown by the green “×” symbols. Independent experimental results [149] of adhesion energy from contact angle measurements on vesicles are indicated by the blue points. Results adapted from Chu et al. [44].
Fig. 17
Fig. 17
Schematic illustration of how mechanical signaling from the ECM acts in concert with biomolecular tumorigenic signaling to activate malignant transformation. Adapted from Ref. [143].
Fig. 18
Fig. 18
The apparent stiffness of (a) ALL and (b) AML leukemic cells (six different tests for the former and five different samples for the latter) exposed to chemotherapy toxicity. Average apparent stiffness of dead (red) leukemic cells after exposure to chemotherapy is higher compared with untreated (beige) cells. For comparison, leukemic cells Jurkat, HL60 and K562 are also shown. Primary ALL cells and lymphoid leukemic cell lines exposed to 1 µM dexamethasone. Primary AML and myeloid leukemic cell lines exposed to 1 µM daunorubicin. Error bars indicate standard error. Results adapted from Ref. [133].
Fig. 19
Fig. 19
Effects of cell type, chemotherapy exposure time and cell death on the stiffness of leukemia cells. (Top figure) The red line and associated data points show that isolated HL60 cells exposed to 1 µM daunorubicin at time 0 (vertical dashed green line) exhibit increased stiffness (by a factor of more than 30) as a function of time of exposure to this chemotherapy agent. If these cells are now also simultaneously treated with 2 µM cytochalasin D, an actin polymerization inhibitor, at time 0, almost no increase in stiffness is seen (green line and data points) with chemotherapy exposure time and cell death. If the cells are simultaneously treated with 2 µM cytochalasin D, at time t = 45 min (indicated by the vertical dashed blue line) after the 1 µM daunorubicin treatment commences, no further increase (in fact a slight reduction) in stiffness is seen (blue line and data points) with chemotherapy exposure time and cell death. (Lower left figure) The average stiffness of dead cells (beige bars) for both HL60 and Jurkat cell lines exposed to both daunorubicin and cytochalasin D is much lower than that for the same cells exposed only to daunorubicin (red bars). (Bottom right figure) The stiffness of isolated AML cells increases as cell death progresses upon treatment with 1 µM daunorubicin. Results adapted from Ref. [133].

References

    1. Fung YC. Biomechanics: mechanical properties of living tissues. New York: Springer-Verlag; 1993.
    1. Fung YC. Biomechanics: motion, flow, stress, and growth. New York: Springer-Verlag; 1990.
    1. Fung YC. Biomechanics: circulation. 2nd ed. New York: Springer-Verlag; 1997.
    1. Fredberg JJ, Stamenovic D. On the imperfect elasticity of lung tissue. J Appl Physiol. 1989;67:2408–2419. - PubMed
    1. Humphrey JD. Cardiovascular solid mechanics: cells, tissues, organs. New York: Springer-Verlag; 2002.

Publication types