

Time trends and geographical variation in cataract surgery rates in England: study of surgical workload
- PMID: 17540694
- PMCID: PMC1955650
- DOI: 10.1136/bjo.2006.108977
Time trends and geographical variation in cataract surgery rates in England: study of surgical workload
Abstract
Background: Phacoemulsification, day case surgery and Action on Cataracts have increased the national capacity for cataract surgery in England.
Aims: To examine time trends and geographical variation in rates of cataract surgery, and to determine whether there is evidence of overcapacity in current levels of surgical provision.
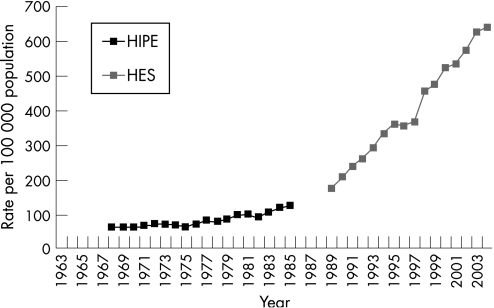
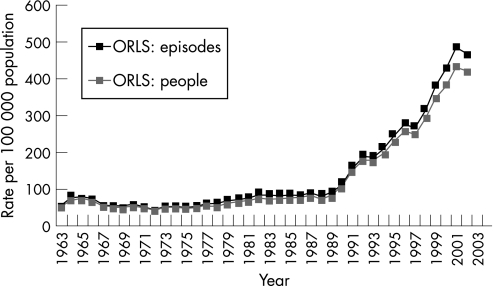
Methods: Hospital episode statistics (HES), the hospital inpatient enquiry (HIPE) and the Oxford record linkage study (ORLS) were analysed for cataract admissions between the 1960s and 2003.
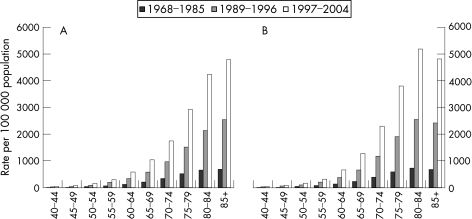
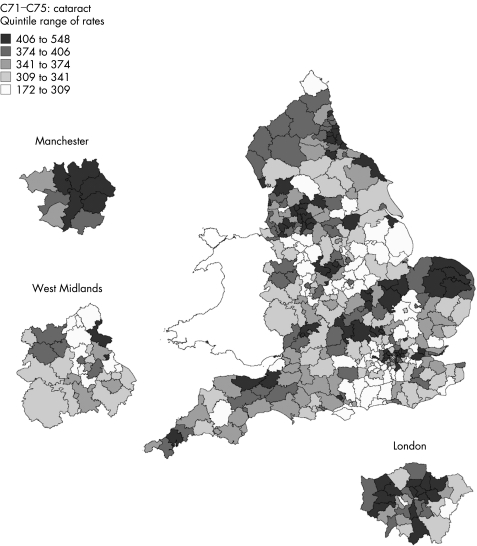
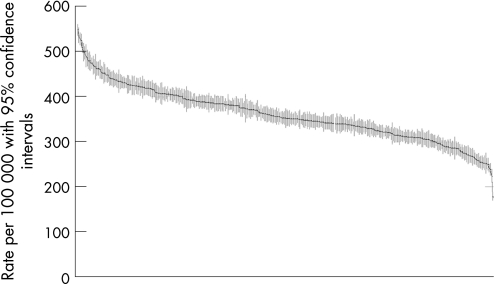
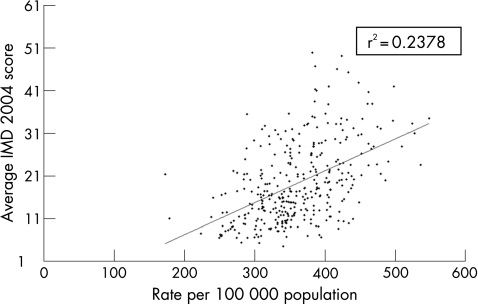
Results: Annual rates of admission for cataract surgery in England rose 10-fold from 1968 to 2003: from 62 episodes per 100,000 population in 1968, through 173 in 1989, to 637 in 2004. The overall increase in cataract surgery was reflected by increases in every age group for both men and women. Geographical analysis showed that there was wide variation across local authority areas in annual rates of cataract surgery, from 172 to 548 people per 100,000 population in 1998-2003. The rate of surgery by local authority was positively correlated with the index of multiple deprivation (r(2) = 0.24).
Conclusion: The huge increase in cataract surgery over time and the wide geographical variation in rates, raise the question of whether there is now overcapacity for cataract surgery. High levels of social deprivation are associated with high rates of cataract surgery; this may be due to an increased prevalence of cataract or differences in referral patterns.
Conflict of interest statement
Competing interests: None declared.
Comment in
-
Cataract surgical rates: is there overprovision in certain areas?Br J Ophthalmol. 2007 Jul;91(7):852-3. doi: 10.1136/bjo.2006.111211. Br J Ophthalmol. 2007. PMID: 17576705 Free PMC article.
-
Cataract surgery in England.Br J Ophthalmol. 2008 May;92(5):722-3. doi: 10.1136/bjo.2007.133256. Br J Ophthalmol. 2008. PMID: 18441187 No abstract available.
References
-
- NHS Executive Action on cataracts: good practice guidance. London: Department of Health, 2000
-
- NHS Executive Growing capacity: independent sector diagnosis and treatment centres. London: Department of Health, 2002
-
- NHS Executive Chief executive's report to the NHS: statistical supplement. London: Department of Health, 2005
-
- NHS Executive Hospital episode statistics. London: Department of Health, 2007, Available at http://www.dh.gov.uk/PublicationsAndStatistics/Statistics/HospitalEpisod... (accessed 21 March 2007)
MeSH terms
LinkOut - more resources
Full Text Sources
Medical