. 2007 Jun 12;104(24):10016-21.
doi: 10.1073/pnas.0610659104. Epub 2007 May 31.

Kinetics and thermodynamics of amyloid formation from direct measurements of fluctuations in fibril mass

Affiliations

Kinetics and thermodynamics of amyloid formation from direct measurements of fluctuations in fibril mass

Tuomas P J Knowles et al. Proc Natl Acad Sci U S A. .

Abstract

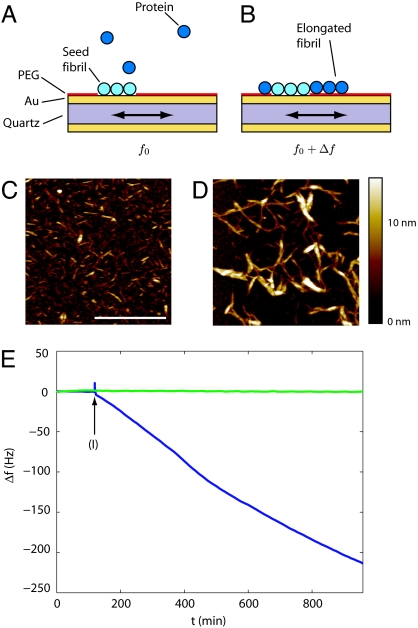
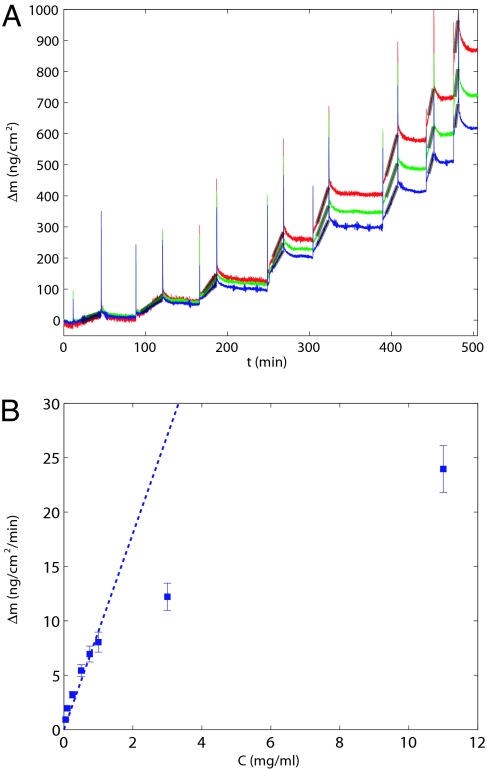
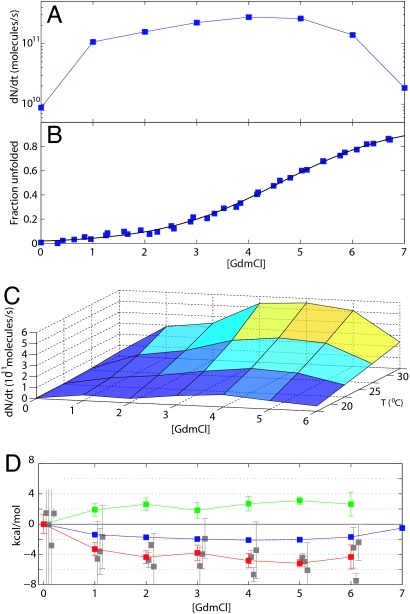
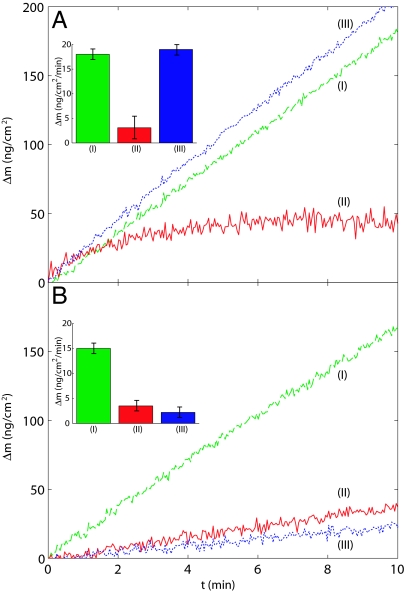
Aggregation of proteins and peptides is a widespread and much-studied problem, with serious implications in contexts ranging from biotechnology to human disease. An understanding of the proliferation of such aggregates under specific conditions requires a quantitative knowledge of the kinetics and thermodynamics of their formation; measurements that to date have remained elusive. Here, we show that precise determination of the growth rates of ordered protein aggregates such as amyloid fibrils can be achieved through real-time monitoring, using a quartz crystal oscillator, of the changes in the numbers of molecules in the fibrils from variations in their masses. We show further that this approach allows the effect of other molecular species on fibril growth to be characterized quantitatively. This method is widely applicable, and we illustrate its power by exploring the free-energy landscape associated with the conversion of the protein insulin to its amyloid form and elucidate the role of a chemical chaperone and a small heat shock protein in inhibiting the aggregation reaction.


Conflict of interest statement

The authors declare no conflict of interest.

Figures

Fig. 1.
Fig. 1.
Growth kinetics from quartz crystal oscillator measurements. Seed fibrils deposited onto a gold surface (A) create well defined growth sites, and upon addition of protein solution the fibrils grow (B), resulting in a decrease in the resonance frequency of the quartz crystal oscillator (E, blue line); in the absence of seed fibrils (E, green line) no shift is measured. The length before (C) and after (D) growth on the gold surface from AFM images is in agreement with the frequency shift measured in E as described. The fibrils were exposed to insulin solution at the time indicated by (I). In C and D the scale bar is 1 μm, and the fibril suspension was diluted by a factor of 5 relative to the QCM measurements to facilitate visualization.
Fig. 2.
Fig. 2.
Concentration dependence of fibril elongation. (A) The sensor with the seed fibrils attached was successively exposed to different concentrations of soluble insulin, resulting in different growth rates measured from the linear fits (gray lines). Three different frequency overtones were simultaneously monitored, n = 3 (red), n = 5 (green), n = 7 (blue). (B) Shown is the average (squares) and the standard error (error bars) of the slopes for the different overtone numbers as a function of the protein concentration. The dashed line shows a one parameter fit through zero to the linear portion of the data.
Fig. 3.
Fig. 3.
Temperature dependence of protein aggregation kinetics. (A and B) Growth rates (A) at different temperatures (B) were extracted from the linear fits (gray, A) of the mass loading as a function of time in the growth phases, and three different overtones were simultaneously monitored, n = 3 (red), n = 5 (green), n = 7 (blue). (C) Shown is the average (squares) and the standard error (error bars) of the slopes for the different overtone numbers as a function of the temperature. The frequency shifts during and just after temperature change are not related to mass change, and measurements were only performed after equilibration at the new temperature (gray vertical bands) as described.
Fig. 4.
Fig. 4.
Denaturant-dependent acceleration and deceleration of amyloid growth. (A) The growth rate of one set of fibrils on the QCM sensor was probed under increasing concentrations of GmdCl. (B) The maximum in the rate coincides approximately with the midpoint of the unfolding transition as monitored by CD. (C and D) Additionally, varying the temperature results in multidimensional landscapes for aggregation rates (C), from which the evolution of the enthalpic (ΔΔH, red) and entropic (TΔΔS, green) contributions to change in the free energy barrier (ΔΔG, blue) can be computed (D). (D) The activation energies were measured independently three times (gray squares), and the average was taken (red squares). Error bar indicates standard error. Additionally for 0 M GdmCl, the value from Fig. 2C is shown. The growth rates are shown here as nominal numbers of molecules converted from the total change in hydrodynamic mass as described; this conversion does not influence the thermodynamical parameters (D).
Fig. 5.
Fig. 5.
Inhibition of amyloid growth by a chemical chaperone and a sHsp. (A) Insulin fibrils were first exposed to an insulin solution in 50 mM glycine buffer, pH 2.5 and 100 mM NaCl (I, green dashed line). The solution was replaced by a mixture containing the same amount of insulin but in addition 1 M TMAO (II, red solid line), and finally a solution of insulin in buffer alone was injected (III, blue dotted line), allowing normal growth to resume. (Inset) The growth rates observed during the successive stages are shown. (B) The effect of sHsp on fibril growth was probed by exposing the fibrils first to an insulin solution in buffer (I, green dashed line) as in A and then to a mixture of 0.5:1 molar ratio of sHsp to insulin (II, red solid line). Finally, a solution of insulin in glycine buffer was introduced (III, blue dotted line) and the resulting low growth rate demonstrates the inactivation of the growth sites by the sHsp molecules. Kinetic data are shown starting from 120 s after the injection of the solutions.

References

    1. Dobson CM. Nature. 2003;426:884–890. - PubMed
    1. Pepys MB. Philos Trans R Soc London B. 2001;356:203–210. discussion 210–211. - PMC - PubMed
    1. Cohen FE, Kelly JW. Nature. 2003;426:905–909. - PubMed
    1. Aguzzi A, Haass C. Science. 2003;302:814–818. - PubMed
    1. Fowler SB, Poon S, Muff R, Chiti F, Dobson CM, Zurdo J. Proc Natl Acad Sci USA. 2005;102:10105–10110. - PMC - PubMed

Publication types

MeSH terms

LinkOut - more resources