. 2007 Jul 27;282(30):21889-900.
doi: 10.1074/jbc.M702841200. Epub 2007 May 31.

Sequential opening of mitochondrial ion channels as a function of glutathione redox thiol status

Affiliations

Sequential opening of mitochondrial ion channels as a function of glutathione redox thiol status

Miguel A Aon et al. J Biol Chem. .

Abstract

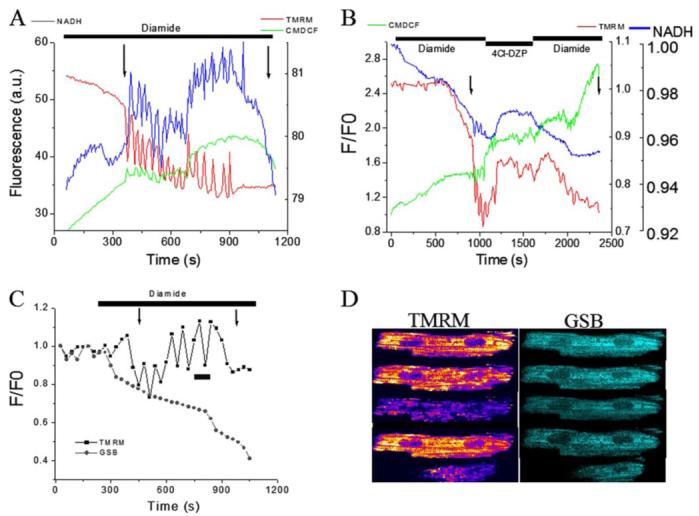
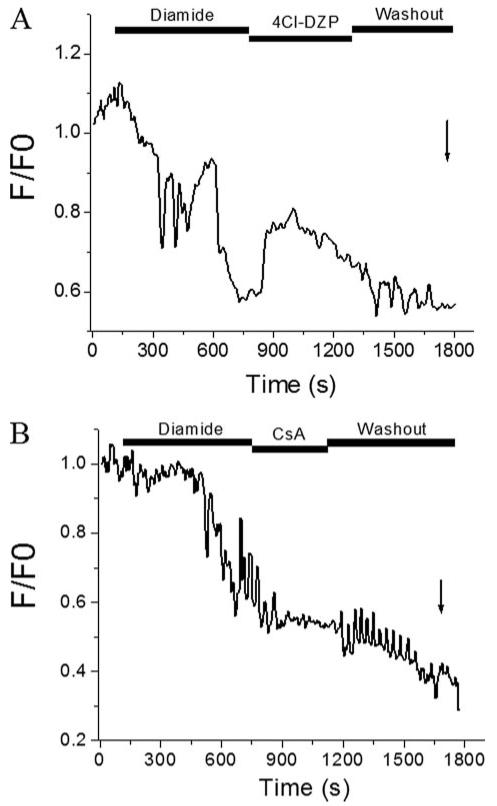
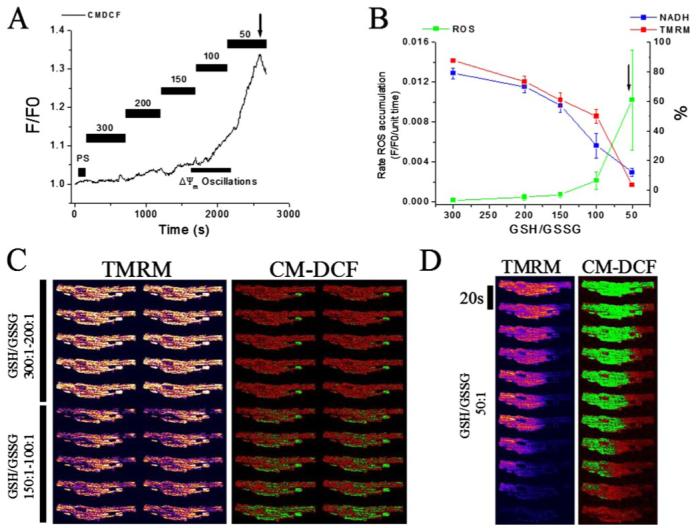
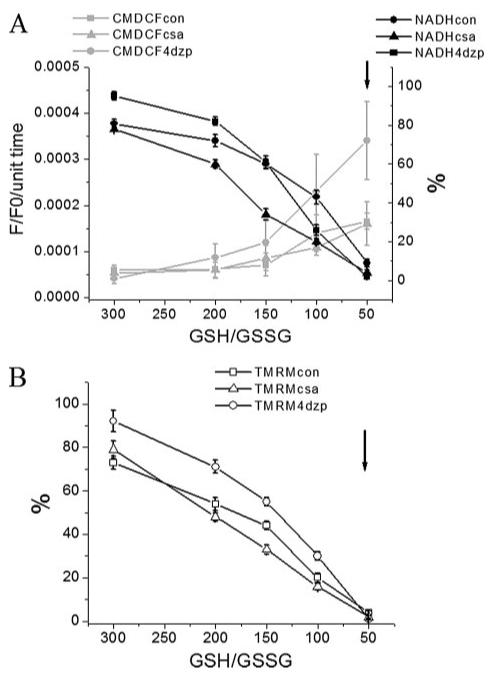
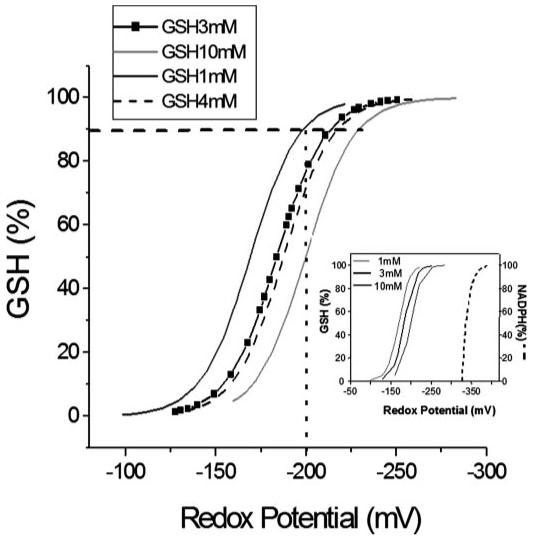
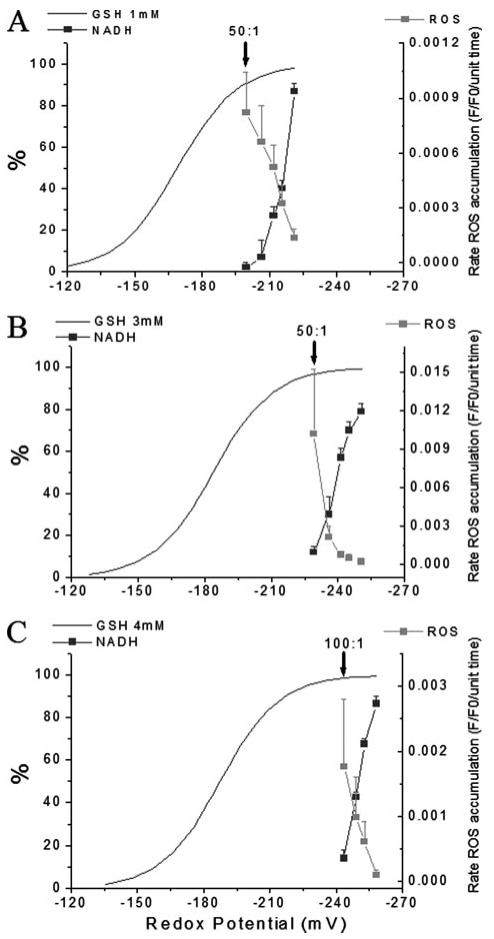
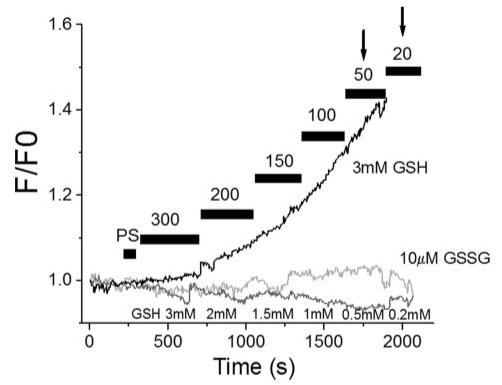
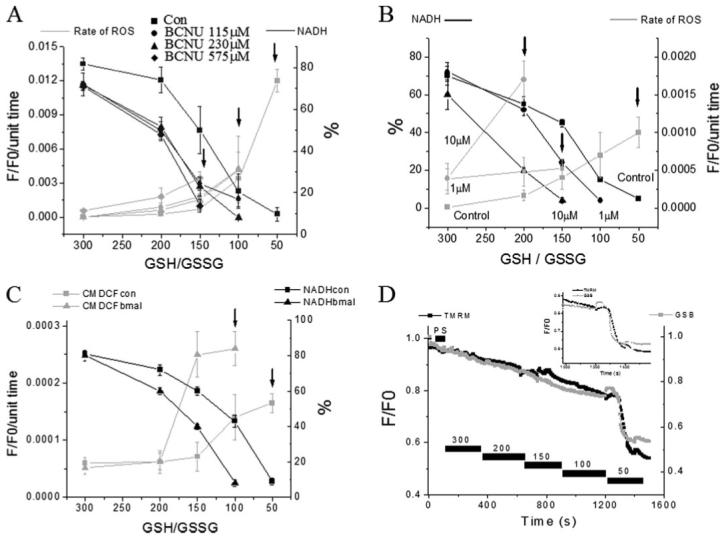
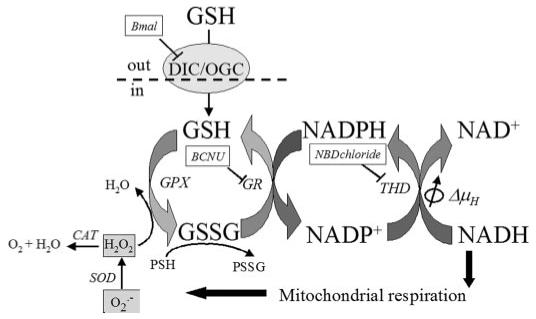
Mitochondrial membrane potential (DeltaPsi(m)) depolarization contributes to cell death and electrical and contractile dysfunction in the post-ischemic heart. An imbalance between mitochondrial reactive oxygen species production and scavenging was previously implicated in the activation of an inner membrane anion channel (IMAC), distinct from the permeability transition pore (PTP), as the first response to metabolic stress in cardiomyocytes. The glutathione redox couple, GSH/GSSG, oscillated in parallel with DeltaPsi(m) and the NADH/NAD(+) redox state. Here we show that depletion of reduced glutathione is an alternative trigger of synchronized mitochondrial oscillation in cardiomyocytes and that intermediate GSH/GSSG ratios cause reversible DeltaPsi(m) depolarization, although irreversible PTP activation is induced by extensive thiol oxidation. Mitochondrial dysfunction in response to diamide occurred in stages, progressing from oscillations in DeltaPsi(m) to sustained depolarization, in association with depletion of GSH. Mitochondrial oscillations were abrogated by 4'-chlorodiazepam, an IMAC inhibitor, whereas cyclosporin A was ineffective. In saponin-permeabilized cardiomyocytes, the thiol redox status was systematically clamped at GSH/GSSG ratios ranging from 300:1 to 20:1. At ratios of 150:1-100:1, DeltaPsi(m) depolarized reversibly, and a matrix-localized fluorescent marker was retained; however, decreasing the GSH/GSSG to 50:1 irreversibly depolarized DeltaPsi(m) and induced maximal rates of reactive oxygen species production, NAD(P)H oxidation, and loss of matrix constituents. Mitochondrial GSH sensitivity was altered by inhibiting either GSH uptake, the NADPH-dependent glutathione reductase, or the NADH/NADPH transhydrogenase, indicating that matrix GSH regeneration or replenishment was crucial. The results indicate that GSH/GSSG redox status governs the sequential opening of mitochondrial ion channels (IMAC before PTP) triggered by thiol oxidation in cardiomyocytes.


Figures

FIGURE 1
FIGURE 1. Diamide-triggered mitochondrial oscillations in intact cardiomyocytes
Freshly isolated guinea pig cardiomyocytes were loaded with TMRM (ΔΨm probe) and CM-H2DCFDA (ROS probe) at 37 °C and imaged by two-photon laser scanning fluorescence microscopy in a perfusion chamber. A, after exposure to the thiol-oxidizing agent diamide (0.1 mm), the oxidation of the ROS probe steadily increased until mitochondrial oscillations were spontaneously triggered. Cycles of ΔΨm depolarization-repolarization and NADH oxidation-reduction continued in-phase, usually for more than 10 min before the irreversible collapse of ΔΨm and maximal NADH oxidation occurred followed by rapid cell contracture. The 1st and 2nd arrows mark the onsets of ΔΨm oscillation and sustained depolarization associated with cell contracture, respectively. Images were collected every 3.5 s. B, mitochondrial benzodiazepine receptor antagonist 4Cl-DZP (64 μm) stopped the diamide-elicited oscillations and stabilized ΔΨm. ΔΨm oscillation and cell death resumed after washout in the continued presence of diamide. C, cardiomyocyte loaded with TMRM (100 nm) and MCB (50 μm) was treated with 0.1 mm diamide under similar conditions as in A and B. Mitochondrial oscillations were triggered after an ∼20% decrease in the GSB fluorescence. Images were acquired every 30 s. D, montage of images taken from the time course depicted in C during an oscillatory cycle and during the irreversible collapse of ΔΨm.
FIGURE 2
FIGURE 2. Inhibition of diamide-induced ΔΨm oscillations by 4Cl-DZP but not CsA
A, freshly isolated cardiomyocytes were loaded with 100 nm TMRM and exposed to 0.1 mm diamide until oscillations were induced. Treatment with 4-Cl-DZP (64 μm) stopped the oscillations and stabilized ΔΨm in the polarized state. After washout of 4Cl-DZP, ΔΨm oscillations returned before the mitochondria irreversibly depolarized and the cell went into contracture. B, at moderate levels of GSH depletion by diamide, ΔΨm oscillations were not reversed by the PTP inhibitor CsA (1 μm). In fact, CsA had a nonspecific depolarizing effect that was the opposite what would be expected for PTP inhibition. More severe GSH depletion activated PTP later in the experiment, as indicated by the arrow. Images were collected every 3.5 s.
FIGURE 3
FIGURE 3. ROS production, ΔΨm, and NADH in saponin-permeabilized cardiomyocytes
Myocytes stored in DMEM were resuspended in the experimental solution in the perfusion chamber and loaded with TMRM (100 nm) and CM-H2DCFDA (2 μm) for at least 20 min. After loading, the excess dye was washed out, and the cells were briefly superfused with a permeabilizing solution (see “Experimental Procedures”) and then continuously perfused with an intracellular solution containing different GSH/GSSG ratios as indicated. ΔΨm, oxidation of the ROS probe, and NADH redox state were simultaneously monitored using two-photon fluorescence excitation. TMRM was included in the medium to avoid depletion of the probe during depolarization-repolarization cycles. A, representative raw trace of CM-DCF signal at different ratios, from which the rates of ROS production are calculated in the steady portion of the signal. The bar within the range 150 - 100:1 indicates where IMAC-dependent ΔΨm oscillations happen. B, rate of oxidation of the ROS probe (F/F0/unit time), NADH (in % of initial fluorescence before permeabilization), and TMRM (ΔΨm, in % of initial fluorescence before permeabilization) obtained from seven different cells in independent experiments (mean ± S.E.) at different GSH/GSSG ratios (3 mm GSH concentration). The arrows in A and B denote the point at which ΔΨm irreversibly collapsed. C and D, representative montage of images of a permeabilized cardiomyocyte loaded with the ΔΨm and ROS sensors at different GSH/GSSG ratios: 300:1 (C, top left), 200:1 (C, top right), 150:1 (C, bottom left), 100:1 (C, bottom right), and 50:1 (D). Notice the ΔΨm oscillation (in the range 150:1 to 100:1) and the irreversible depolarization with exit of the ROS probe from mitochondria (50:1).
FIGURE 4
FIGURE 4. ROS production, ΔΨm, and NADH in permeabilized cardiomyocytes in the presence of IMAC or PTP inhibitors
Myocytes were handled, loaded with the ΔΨm and ROS sensors, and permeabilized as described in the legend of Fig. 3. Rate of oxidation of the ROS probe (F/F0/unit time), NADH (in % of initial fluorescence before permeabilization) (A), and ΔΨm (in % of initial TMRM fluorescence before permeabilization) (B) obtained from four cells in the absence or the presence of 60 μm 4CL-DZP or 1 μm CsA (mean ± S.E.; 2 experiments) at different GSH/GSSG ratios (3 mm GSH concentration). The arrows in A and B denote the point at which ΔΨm irreversibly collapsed. Key to symbols: con, control; csa, cyclosporin A; 4dzp, 4Cl-DZP.
FIGURE 5
FIGURE 5. Relationship between glutathione redox potential, GSH/GSSG ratio, and GSH pool size
The glutathione redox potential, Ehc, was calculated according to Equation 1 in the text. The main panel shows how the total concentration of GSH influences the Ehc midpoint potential and how the pool size influences the % oxidation of the GSH pool. For example, if 10% of the GSH is oxidized to GSSG (horizontal dashed line), then for an initial GSH concentration of 10 mm, Ehc = -230 mV; for 4 mm, Ehc = -218 mV; for 3 mm, Ehc = -214 mV; and for 1 mm, Ehc = -200 mV. Thus, a cell with 10 mm GSH will have a higher reduction potential and a higher reducing capacity than one containing 1 mm GSH. The inset shows the reduction potential of NADP+/NADPH, whose negative redox potential (-400 mV (6)) makes it a key electron donor for the GSH system, for other redox systems (1), and for biosynthetic reactions. In general, NADPH is a cofactor in reductive (biosynthetic) reactions and serves as a source of electrons, whereas NAD+-dependent reactions are oxidative (catabolic) reactions where NAD+ serves as a sink for electrons. As opposed to the NADH/NAD+ ratio (= 100:1), the NADPH/NADP+ ratio is much lower (1:100) in cells and tissues (for review see Refs. 1, 6). The numbers at the top left of the inset correspond to GSH concentrations whose redox potential is represented in the plot (three continuous lines), and NADPH redox potential is shown in dashed line.
FIGURE 6
FIGURE 6. Effects of glutathione redox status and pool size on mitochondrial ROS production, NADH, and ΔΨm in permeabilized myocytes
The rates of oxidation of the matrix localized CM-H2DCF (ROS probe) and the NADH autofluorescence at different GSH/GSSG ratios are compared for total GSH concentrations of 1 mm (A), 3 mm (B), and 4 mm (C). Data are plotted as a function of the glutathione reduction potential for the GSH/GSSG solutions, calculated as shown in Fig. 5. Note that the midpoint of the curve describing the acceleration of ROS production lies in a region where there is a relatively small change in Ehc. Moreover, the redox potential at which ΔΨm collapses differs significantly depending on the GSH pool size, indicating that the mechanism of mitochondrial dysfunction is not strictly dependent on the reduction potential of the cytoplasmic solution. The arrows in A-C denote the ratio at which ΔΨm irreversibly collapsed.
FIGURE 7
FIGURE 7. Effects of GSH or GSSG concentration on mitochondrial ROS production in permeabilized myocytes
GSH/GSSG ratio was varied between 300:1 and 20:1 with either a GSH fixed at 3 mm or with GSSG fixed at 10 μm. Increasing GSSG at a fixed GSH induced corresponding increases in the rate of oxidation of the ROS probe while clamping GSSG to 10 μm inhibited ROS production and shifted mitochondrial ΔΨm depolarization (arrows) to a lower ratio (20:1).
FIGURE 8
FIGURE 8. Mitochondrial redox status and ROS production in response to inhibition of enzymes responsible for mitochondrial GSH regeneration and GSH transport
NADH (as % of initial level) and ROS production in saponin-permeabilized cardiomyocytes were exposed to different GSH/GSSG ratios. A, concentration-dependent effects of the glutathione reductase inhibitor BCNU. B, concentration-dependent effects of the NADH/NADPH transhydrogenase inhibitor NBD chloride. C, rate of oxidation of the ROS probe (F/F0/unit time) and NADH (in % of initial fluorescence before permeabilization) in the absence or the presence of 200 μm butyl malonate obtained from four cells (mean ± S.E.; two experiments). The rates of ROS production and NADH oxidation were similar to the control in the presence of 100 μm butyl malonate (not shown). The arrows denote the GSH/GSSG ratio at which ΔΨm collapsed irreversibly. ΔΨm collapses at increasingly higher (more reduced redox potentials) GSH/GSSG ratios in the presence of increasing concentrations of the inhibitors. D, timing of the depletion of reduced glutathione levels and ΔΨm induced by decreasing the GSH/GSSG ratio in saponin-permeabilized cardiomyocytes. Cells were loaded with 100 nm TMRM and 50 μm MCB and then permeabilized to remove the cytoplasmic component of GSB. Inset, note that the rapid oxidation of the mitochondrial GSB signal occurs ∼30 s before the irreversible collapse of ΔΨm. Key to symbols: con, control; bmal, butyl malonate.
FIGURE 9
FIGURE 9. Coupled glutathione, NADH, and NADPH redox cycles in the mitochondrial matrix
This scheme shows the carrier-mediated mitochondrial GSH uptake and the main enzymatic steps involved in the regeneration of GSH and NADPH in the mitochondrial matrix. DIC, dicarboxylate carrier (its inhibition by butyl malonate, Bmal, is indicated); OGC, 2-oxoglutarate carrier; GPX, glutathione peroxidase; GR, NADPH-dependent glutathione reductase (its inhibition by carmustine, BCNU, is indicated); THD, transhydrogenase (its inhibition by NBD chloride, NBD chloride, is indicated); ΔμH, proton electrochemical gradient; CAT, catalase; SOD, Mn-superoxide dismutase; PSSG, protein-SSG mixed disulfides; PSH, protein-SH. ROS is highlighted in light gray: O2, superoxide anion; H2O2, hydrogen peroxide.

References

    1. Schafer FQ, Buettner GR. Free Radic. Biol. Med. 2001;30:1191–1212. - PubMed
    1. Chance B, Sies H, Boveris A. Physiol. Rev. 1979;59:527–605. - PubMed
    1. Rebrin I, Kamzalov S, Sohal RS. Free Radic. Biol. Med. 2003;35:626–635. - PMC - PubMed
    1. Shelton MD, Chock PB, Mieyal JJ. Antioxid. Redox. Signal. 2005;7:348–366. - PubMed
    1. Sies H. Free Radic. Biol. Med. 1999;27:916–921. - PubMed

Publication types

MeSH terms

LinkOut - more resources