. 2007 Jul 20;282(29):21056-67.
doi: 10.1074/jbc.M700664200. Epub 2007 May 31.

Evidence that the heme regulatory motifs in heme oxygenase-2 serve as a thiol/disulfide redox switch regulating heme binding

Affiliations

Evidence that the heme regulatory motifs in heme oxygenase-2 serve as a thiol/disulfide redox switch regulating heme binding

Li Yi et al. J Biol Chem. .

Abstract

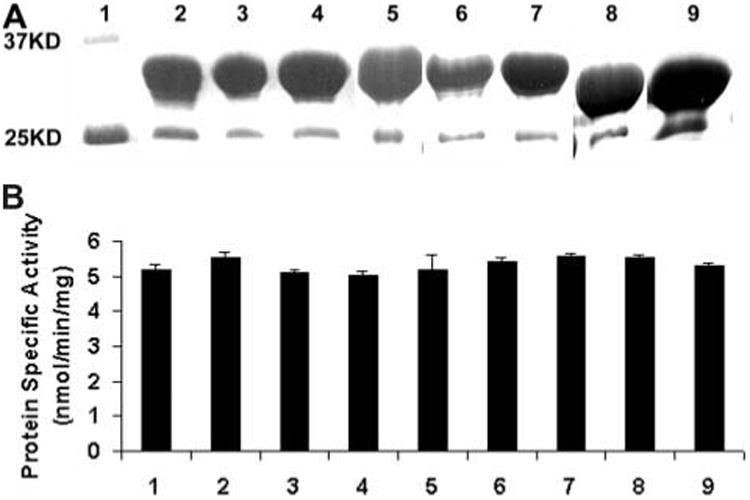
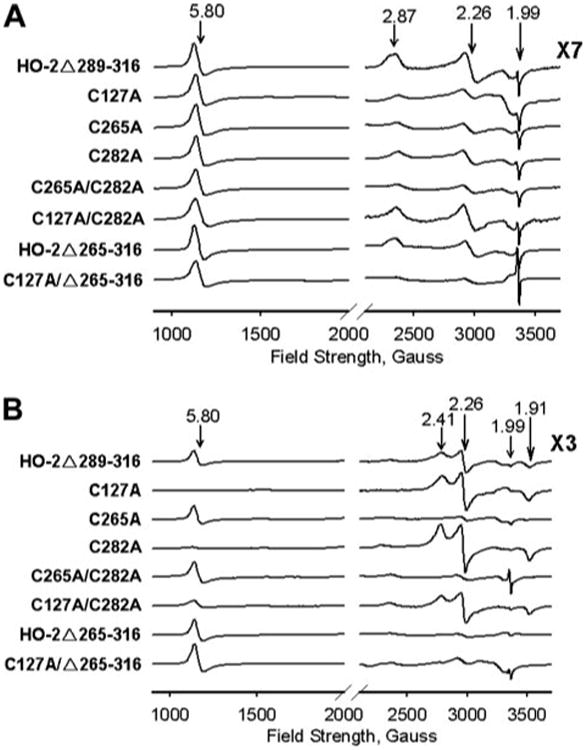
Heme oxygenase (HO) catalyzes the O(2)- and NADPH-dependent conversion of heme to biliverdin, CO, and iron. The two forms of HO (HO-1 and HO-2) share similar physical properties but are differentially regulated and exhibit dissimilar physiological roles and tissue distributions. Unlike HO-1, HO-2 contains heme regulatory motifs (HRMs) (McCoubrey, W. K., Jr., Huang, T. J., and Maines, M. D. (1997) J. Biol. Chem. 272, 12568-12574). Here we describe UV-visible, EPR, and differential scanning calorimetry experiments on human HO-2 variants containing single, double, and triple mutations in the HRMs. Oxidized HO-2, which contains an intramolecular disulfide bond linking Cys(265) of HRM1 and Cys(282) of HRM2, binds heme tightly. Reduction of the disulfide bond increases the K(d) for ferric heme from 0.03 to 0.3 microm, which is much higher than the concentration of the free heme pool in cells. Although the HRMs markedly affect the K(d) for heme, they do not alter the k(cat) for heme degradation and do not bind additional hemes. Because HO-2 plays a key role in CO generation and heme homeostasis, reduction of the disulfide bond would be expected to increase intracellular free heme and decrease CO concentrations. Thus, we propose that the HRMs in HO-2 constitute a thiol/disulfide redox switch that regulates the myriad physiological functions of HO-2, including its involvement in the hypoxic response in the carotid body, which involves interactions with a Ca(2+)-activated potassium channel.


Figures

Figure 1
Figure 1. HO-2 variants studied
Two truncated forms of HO-2 lacking regions 289–316 and 265–316 and several HO-2 variants were generated. The Cys-Pro (CP) motifs at positions 265, 282, and 127 are designated HRM1, HRM2, and HRM3. The C127A/Δ265–316 variant was generated in HO-2Δ265–316, whereas the other Cys variants were generated in HO-2Δ289–316.
Figure 2
Figure 2. HO-2 expression and activity
A, purified HO-2 proteins were subjected to SDS-PAGE. Lane 1, molecular mass markers; lane 2, 40 μg of HO-2Δ289–316; lane 3, 40 μg of C127A; lane 4, 40 μg of C127A/C282A; lane 5, 40 μg of C282A; lane 6, 40 μg of C265A; lane 7, 40 μg of C265A/C282A; lane 8, 40 μg of HO-2 Δ265–316; lane 9, 40 μg of C127A/Δ265–316. B, heme oxygenase activity was determined by calculating the rate of bilirubin synthesis (see “Experimental Procedures”). Bar 1, human full-length HO-2; bar 2, HO-2Δ289–316; bar 3, C127A; bar 4, C265A; bar 5, C282A; bar 6, C265A/C282A; bar 7, C127A/C282A; bar 8, HO-2Δ265–316; bar 9, C127A/Δ265–316. All measurements were done in triplicate. HO-2 variants were constructed and purified as described under “Experimental Procedures.”
Figure 3
Figure 3. DSC experiments of HO-2 and HRM variants
All DSC data were fit to a non-two-state model. Solid lines, experimental data; dotted lines, fit of the DSC data to a non-two-state model. Trace a, HO-2Δ289–316; trace b, C127A; trace c, C265A; trace d, C282A; trace e, C127A/C282A. The fit parameters are shown in Table 1.
Figure 4
Figure 4. Absorption spectra of HO-2-heme complexes
The HO-2 concentration was 8 μm, and the same concentration of heme solution was used as a reference. The insets are expansions of the 475–650 nm range. A, oxidized HO-2·Fe3+ heme-complex; B, HO-2·Fe2+ heme complex; C, oxidized HO-2·Fe2+ heme-CO complex. Solid lines, HO-2Δ289–316; long dashed lines, C127A; medium dashed lines, C265A; short dashed lines, C282A; dotted lines, C265A/C282A; dashed/dotted lines, C127A/C282A; dashed/dotted/dotted lines, HO-2Δ265–316; dashed/dotted/dotted/dotted lines, C127A/Δ265–316. D, reduced HO-2Δ289–316·heme complexes. Solid line, HO-2·Fe3+ heme; dashed line, HO-2·Fe2+ heme; dashed/dotted line, HO-2·Fe2+ heme-CO.
Figure 5
Figure 5. Fe3+ heme binding to HO-2 by the pyridine hemochrome assay
A, 1.58 μm HO-2Δ265–316; B, 1.51 μmC282A. Protein concentration was calculated by the rose bengal method. The heme concentration was determined by following the absorbance change at 556 nm (see “Experimental Procedures”).
Figure 6
Figure 6. Titration curves of HO-2Δ289–316 with Fe3+ and Fe2+ heme
Titration curves were developed by monitoring the absorbance increases at 406 nm (Fe3+) and 430 nm (Fe2+). ○, 8 μm oxidized HO-2Δ289–316 titrated with Fe3+ heme in air; □, 8 μm reduced HO-2Δ289–316 titrated with Fe3+ heme under anaerobic conditions; △, 8 μm reduced HO-2Δ289–316 titrated with Fe2+ heme under anaerobic conditions. Kd values were calculated using a quadratic equation with a one-site binding model (see “Experimental Procedures”).
Figure 7
Figure 7. EPR spectra of ferric heme complexed with oxidized and reduced HRMs
Samples were prepared at a 1:1 ratio of Fe3+ heme and HO-2 as described under “Experimental Procedures.” EPR measurements were performed at 10 K with a microwave frequency of 9.39 GHz, a microwave power of 1 milliwatt, and a field modulation amplitude of 10.15 G at 100 kHz. A, samples of Fe3+ heme plus oxidized HO-2 prepared in air; B, samples of Fe3+ heme plus reduced HO-2 prepared under anaerobic conditions (see “Experimental Procedures”).
Figure 8
Figure 8
Alignment of selected HO-2 and HO-1 sequences.
Scheme 1
Scheme 1
Proposed mechanism of intramolecular disulfide bond formation in HO-2 between HRM1 and HRM2.

Similar articles

Cited by

References

    1. Maines MD. Antioxid Redox Signal. 2004;6:797–801. - PubMed
    1. Maines MD. Physiology (Bethesda) 2005;20:382–389. - PubMed
    1. Sassa S. Antioxid Redox Signal. 2006;38:138–155.
    1. Qi Z, Hamza I, O'Brian MR. Proc Natl Acad Sci U S A. 1999;96:13056–13061. - PMC - PubMed
    1. Ogawa K, Sun J, Taketani S, Nakajima O, Nishitani C, Sassa S, Hayashi N, Yamamoto M, Shibahara S, Fujita H, Igarashi K. EMBO J. 2001;20:2835–2843. - PMC - PubMed

Publication types

LinkOut - more resources