

Processing MALDI Mass Spectra to Improve Mass Spectral Direct Tissue Analysis
- PMID: 17541451
- PMCID: PMC1885223
- DOI: 10.1016/j.ijms.2006.10.005
Processing MALDI Mass Spectra to Improve Mass Spectral Direct Tissue Analysis
Abstract
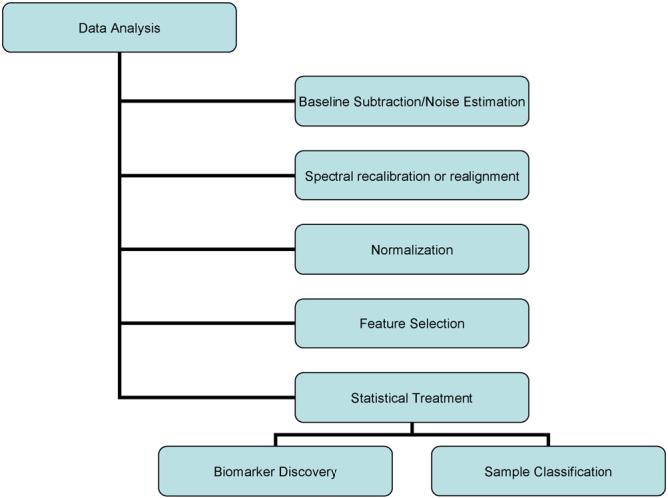
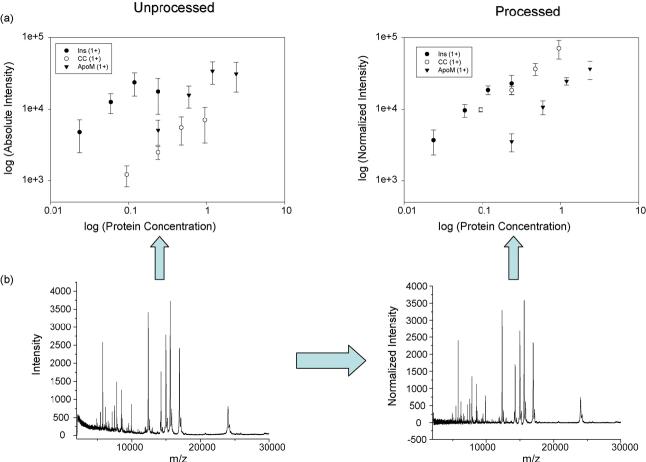
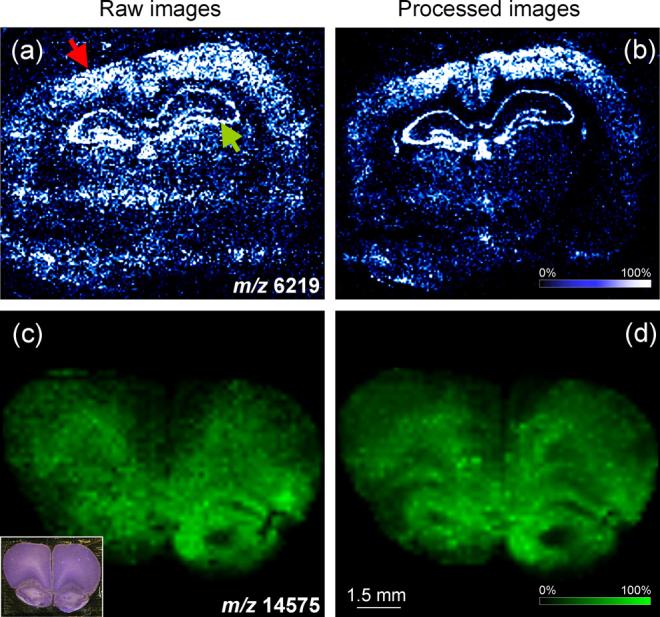
Profiling and imaging biological specimens using MALDI mass spectrometry has significant potential to contribute to our understanding and diagnosis of disease. The technique is efficient and high-throughput providing a wealth of data about the biological state of the sample from a very simple and direct experiment. However, in order for these techniques to be put to use for clinical purposes, the approaches used to process and analyze the data must improve. This study examines some of the existing tools to baseline subtract, normalize, align, and remove spectral noise for MALDI data, comparing the advantages of each. A preferred workflow is presented that can be easily implemented for data in ASCII format. The advantages of using such an approach are discussed for both molecular profiling and imaging mass spectrometry.
Figures
Similar articles
-
Software tools of the Computis European project to process mass spectrometry images.Eur J Mass Spectrom (Chichester). 2014;20(5):351-60. doi: 10.1255/ejms.1293. Eur J Mass Spectrom (Chichester). 2014. PMID: 25707124
-
Profiling of Microbial Colonies for High-Throughput Engineering of Multistep Enzymatic Reactions via Optically Guided Matrix-Assisted Laser Desorption/Ionization Mass Spectrometry.J Am Chem Soc. 2017 Sep 13;139(36):12466-12473. doi: 10.1021/jacs.7b04641. Epub 2017 Aug 30. J Am Chem Soc. 2017. PMID: 28792758 Free PMC article.
-
2D and 3D MALDI-imaging: conceptual strategies for visualization and data mining.Biochim Biophys Acta. 2014 Jan;1844(1 Pt A):117-37. doi: 10.1016/j.bbapap.2013.01.040. Epub 2013 Mar 4. Biochim Biophys Acta. 2014. PMID: 23467008
-
MALDI-ToF Mass Spectra Phenomic Analysis for Human Disease Diagnosis Enabled by Cutting-Edge Data Processing Pipelines and Bioinformatics Tools.Curr Med Chem. 2021;28(32):6532-6547. doi: 10.2174/0929867327666201027154257. Curr Med Chem. 2021. PMID: 33109029 Review.
-
Translational Metabolomics of Head Injury: Exploring Dysfunctional Cerebral Metabolism with Ex Vivo NMR Spectroscopy-Based Metabolite Quantification.In: Kobeissy FH, editor. Brain Neurotrauma: Molecular, Neuropsychological, and Rehabilitation Aspects. Boca Raton (FL): CRC Press/Taylor & Francis; 2015. Chapter 25. In: Kobeissy FH, editor. Brain Neurotrauma: Molecular, Neuropsychological, and Rehabilitation Aspects. Boca Raton (FL): CRC Press/Taylor & Francis; 2015. Chapter 25. PMID: 26269925 Free Books & Documents. Review.
Cited by
-
Analysis of tissue specimens by matrix-assisted laser desorption/ionization imaging mass spectrometry in biological and clinical research.Chem Rev. 2013 Apr 10;113(4):2309-42. doi: 10.1021/cr3004295. Epub 2013 Feb 11. Chem Rev. 2013. PMID: 23394164 Free PMC article. Review. No abstract available.
-
Mass spectrometry imaging of lipids: untargeted consensus spectra reveal spatial distributions in Niemann-Pick disease type C1.J Lipid Res. 2018 Dec;59(12):2446-2455. doi: 10.1194/jlr.D086090. Epub 2018 Sep 28. J Lipid Res. 2018. PMID: 30266834 Free PMC article.
-
MALDI mass spectrometry imaging of 1-methyl-4-phenylpyridinium (MPP+) in mouse brain.Neurotox Res. 2014 Jan;25(1):135-45. doi: 10.1007/s12640-013-9449-5. Epub 2013 Dec 18. Neurotox Res. 2014. PMID: 24347373
-
MALDI imaging mass spectrometry: state of the art technology in clinical proteomics.Mol Cell Proteomics. 2009 Sep;8(9):2023-33. doi: 10.1074/mcp.R800016-MCP200. Epub 2009 May 18. Mol Cell Proteomics. 2009. PMID: 19451175 Free PMC article. Review.
-
Mass Spectrometry Analysis of Intact Proteins from Crude Samples.Anal Chem. 2020 Oct 6;92(19):12741-12749. doi: 10.1021/acs.analchem.0c02162. Epub 2020 Sep 22. Anal Chem. 2020. PMID: 32897050 Free PMC article.
References
-
- Rohner TC, Staab D, Stoeckli M. Mech. Ageing Dev. 2005;126:177. - PubMed
-
- Reyzer ML, Caprioli RM. J. Proteome Res. 2005;4:1138. - PubMed
-
- Crossman L, McHugh NA, Hsieh YS, Korfmacher WA, Chen JW. Rapid Commun. Mass Spectrom. 2006;20:284. - PubMed
-
- Altelaar AFM, Klinkert I, Jalink K, de Lange RPJ, Adan RAH, Heeren RMA, Piersma SR. Anal. Chem. 2006;78:734. - PubMed
-
- DeKeyser SS, Li LJ. Analyst. 2006;131:281. - PubMed
Grants and funding
LinkOut - more resources
Full Text Sources
Other Literature Sources