. 2007 Aug;46(2):548-57.
doi: 10.1002/hep.21682.

Genome-level analysis of genetic regulation of liver gene expression networks

Affiliations

Genome-level analysis of genetic regulation of liver gene expression networks

Daniel Gatti et al. Hepatology. 2007 Aug.

Abstract

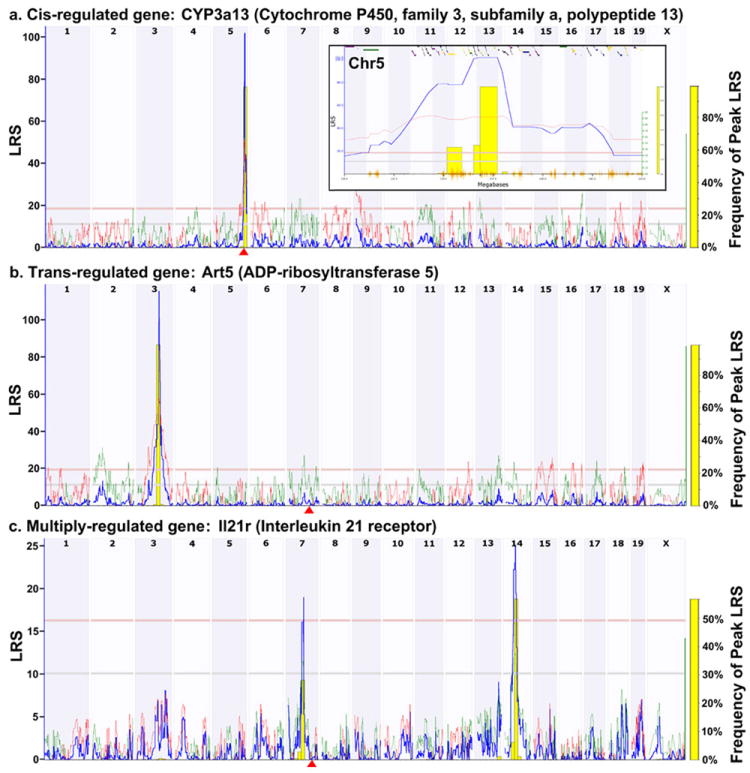
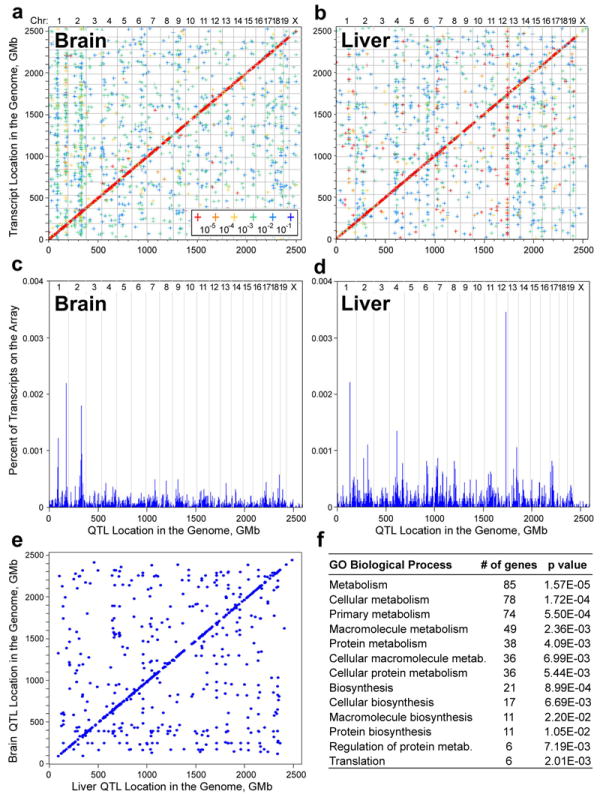
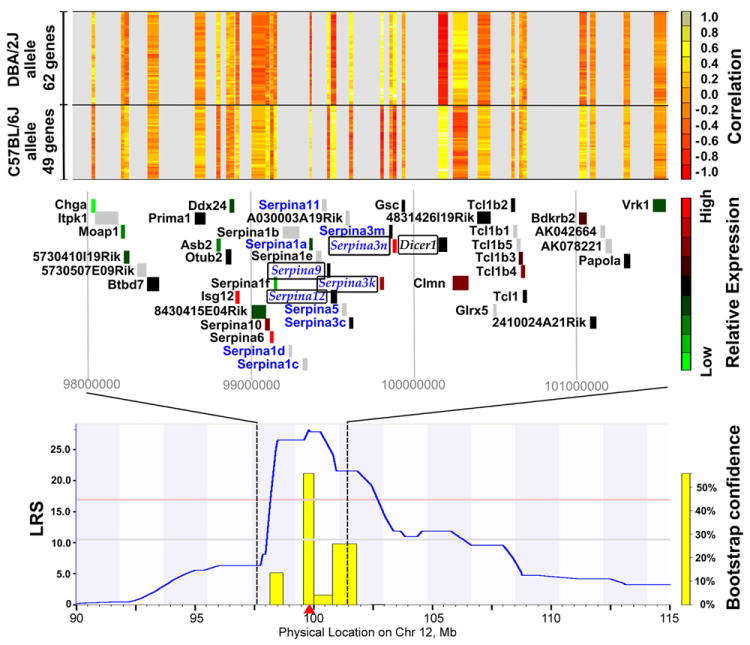
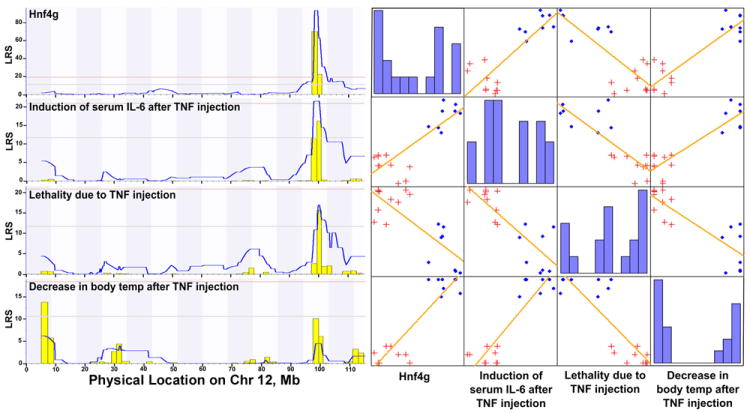
The liver is the primary site for the metabolism of nutrients, drugs, and chemical agents. Although metabolic pathways are complex and tightly regulated, genetic variation among individuals, reflected in variations in gene expression levels, introduces complexity into research on liver disease. This study dissected genetic networks that control liver gene expression through the combination of large-scale quantitative mRNA expression analysis with genetic mapping in a reference population of BXD recombinant inbred mouse strains for which extensive single-nucleotide polymorphism, haplotype, and phenotypic data are publicly available. We profiled gene expression in livers of naive mice of both sexes from C57BL/6J, DBA/2J, B6D2F1, and 37 BXD strains using Agilent oligonucleotide microarrays. These data were used to map quantitative trait loci (QTLs) responsible for variations in the expression of about 19,000 transcripts. We identified polymorphic local and distant QTLs, including several loci that control the expression of large numbers of genes in liver, by comparing the physical transcript position with the location of the controlling QTL.

Conclusion: The data are available through a public web-based resource (www.genenetwork.org) that allows custom data mining, identification of coregulated transcripts and correlated phenotypes, cross-tissue, and cross-species comparisons, as well as testing of a broad array of hypotheses.


Conflict of interest statement

Conflict of Interest

The authors declare they have no competing financial interest.

Figures

Figure 1
Figure 1. WebQTL interval mapping reveals genetic control of gene expression
a, An example of a cis-regulated gene (Cyp3a13) where the QTL is co-located with the gene. The horizontal axis displays the mouse genome. The vertical axis displays the Likelihood Ratio Statistic (LRS), The gene location is shown by the red triangle. The red horizontal line indicates a significant level of association as determined by permutation analysis. The grey horizontal line below it represents a suggestive association. The blue line displays the LRS along the genome and the yellow bars are the results of a bootstrap analysis. The inset shows a zoomed-in view of the Cyp3a13 QTL on Chr5 (130-145Mb) and illustrates the features of WebQTL. The red line indicates that C57BL/6J alleles at the marker increase expression of the gene. The colored boxes along the top represent known genes which, when selected, will take the user to the NCBI EntrezGene entry for that gene. A SNP track is displayed along the bottom as an orange seismogram. b, An example a trans-regulated gene (Art5). c, An example of a gene (Il21r) that is regulated by multiple loci.
Figure 2
Figure 2. Genome-wide clustering of the genetic control of gene expression in liver
a, Hierarchical clustering diagram of all transcripts on the array by Likelihood Ratio Statistic (LRS) profile. Rows – transcripts on the microarray, columns – SNP markers used for the QTL analysis. Strength of the LRS values is depicted using a head map with black being the lowest LRS, and bright red – the highest. b, A zoomed-in view of the cluster of genes controlled by a single genetic locus on Chr8. An auto-correlation matrix of the measured expression values for the transcripts in the cluster and a plot of chromosomal location of these transcripts are shown below. c, A cluster of 111 transcripts controlled by one locus on Chr12. d, A cluster of 43 transcripts that are controlled by a complex set of loci on several chromosomes.
Figure 3
Figure 3. Tissue-specific transcriptome maps reveal differences and similarities in genetic regulation of gene expression
a-b, The brain and liver (this study) transcriptome maps. The horizontal axis shows the genomic location of each genetic marker along the genome. The vertical axis shows the genomic location of each transcript probed by the microarray analysis. Each cross represents the location of the maximum QTL for a particular gene. Cis-regulated genes, where the QTL is co-located with the gene, fall along a 45 degree line. The vertical lines correspond to a locus with strong trans-control over many genes. The major loci of control differ markedly in the murine brain and liver. c-d, Histograms counting the proportion of transcripts on the array regulated at each marker. e, A comparative transcriptome map between the murine liver and brain. Significant QTLs in the liver and brain are plotted along the horizontal and vertical axes, respectively. Points along the diagonal represent transcripts whose maximum QTL is the same in both tissues, indicating a similar mechanism of expression control. Points plotted off of the diagonal represent transcripts that are controlled by different loci in the two tissues. f, Gene Ontology analysis of the significantly enriched biological processes common between liver and brain in the mouse
Figure 4
Figure 4. Chr12 locus is a master-regulator of gene expression in mouse liver
A zoomed-in view of the region on Chr12 that controls a large number of trans-regulated transcripts is shown in the bottom panel. The middle panel is a detail of the QTL peak from 98 Mb to 102 Mb showing the genes in this region. Genes labeled in blue text have non-synonymous coding SNPs. Genes in italics are cis-regulated. Genes in plain text are trans-regulated. The gene location marker is color coded based on relative expression in the mouse liver. Green indicates low expression; red indicates high expression; grey indicates that the gene is not represented on the microarray. The top panel shows the correlation between the expression of each gene located in this locus and the putative trans-regulated genes. Red indicates negative correlation; yellow indicates positive correlation; grey indicates no information. Genes in the upper part of the panel are highly expressed in strains with the DBA/2J allele at this Chr12 locus. Genes on the bottom of the panel are highly expressed in strains with the C57BL/6J allele is at this locus.
Figure 5
Figure 5. In silico discovery of gene expression to phenotype correlations using WebQTL
The left panel shows QTL interval maps on Chr12 for hepatocyte nuclear factor 4, gamma (Hnf4g) gene and three related phenotypes. The right panel shows correlation pair-wise correlation plots for Hnf4g expression and the phenotypes. Each dot represents the measurements for one strain. Blue dots indicate strains in which the C57BL/6J allele is present at the Chr12 (99.83Mb) locus. Red crosses represent strains with the DBA/2J allele at this locus. The blue histograms along the diagonal represent the distribution of all values of the phenotype.
Figure 6
Figure 6. WebQTL-assisted strain selection for phenotypic profiling
The main panel shows relative expression of Fmo3 (flavin monooxygenase 3) across BXD strains measured by microarray. Red circles are values in females; blue squares – in males and the strain means are shown as black circles. The lower panels show relative Fmo3 expression in select strains as measured by microarray vs. quantitative real time PCR. The expression of Fmo3 in BXD21 strain was set to 0.

Similar articles

Cited by

References

    1. Brem RB, Yvert G, Clinton R, Kruglyak L. Genetic dissection of transcriptional regulation in budding yeast. Science. 2002;296:752–755. - PubMed
    1. Schadt EE, Monks SA, Drake TA, Lusis AJ, Che N, Colinayo V, et al. Genetics of gene expression surveyed in maize, mouse and man. Nature. 2003;422:297–302. - PubMed
    1. Chesler EJ, Lu L, Shou S, Qu Y, Gu J, Wang J, et al. Complex trait analysis of gene expression uncovers polygenic and pleiotropic networks that modulate nervous system function. Nat Genet. 2005;37:233–242. - PubMed
    1. Waring JF, Jolly RA, Ciurlionis R, Lum PY, Praestgaard JT, Morfitt DC, et al. Clustering of hepatotoxins based on mechanism of toxicity using gene expression profiles. Toxicol Appl Pharmacol. 2001;175:28–42. - PubMed
    1. Powell CL, Kosyk O, Ross PK, Schoonhoven R, Boysen G, Swenberg JA, et al. Phenotypic anchoring of acetaminophen-induced oxidative stress with gene expression profiles in rat liver. Toxicol Sci. 2006;93:213–222. - PMC - PubMed

Publication types