

Selective breeding for infant rat separation-induced ultrasonic vocalizations: developmental precursors of passive and active coping styles
- PMID: 17543397
- PMCID: PMC2759113
- DOI: 10.1016/j.bbr.2007.04.014
Selective breeding for infant rat separation-induced ultrasonic vocalizations: developmental precursors of passive and active coping styles
Abstract
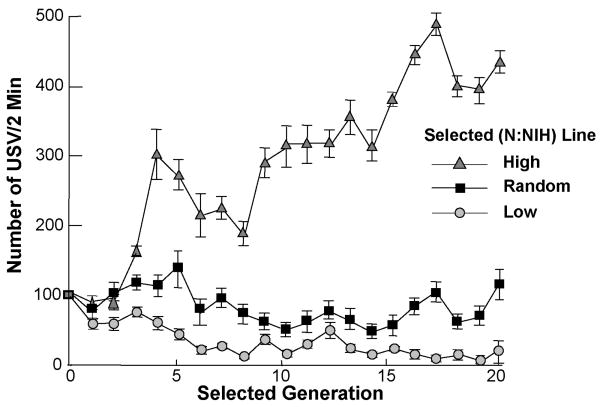
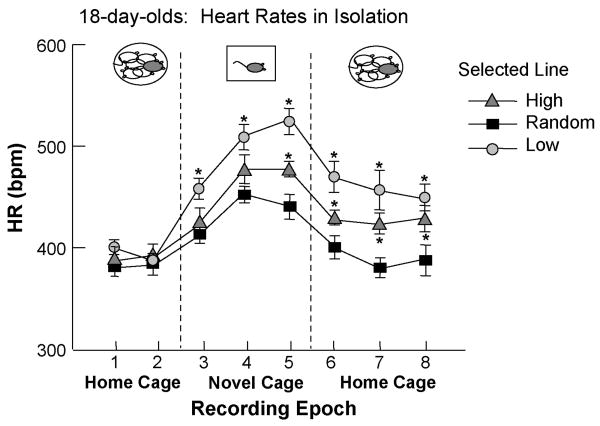
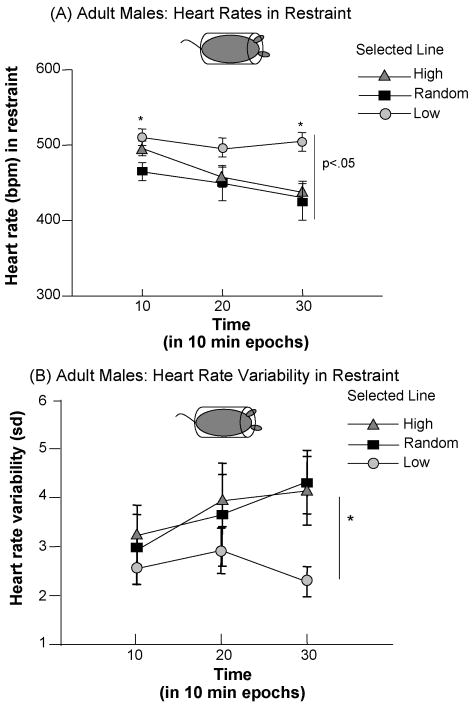
Human depression and anxiety disorders show inherited biases across generations, as do antisocial disorders characterized by aggression. Each condition is preceded in children by behavioral inhibition or aggressive behavior, respectively, and both are characterized by separation anxiety disorders. In affected families, adults and children exhibit different forms of altered autonomic nervous system regulation and hypothalamic-pituitary-adrenal activity in response to stress. Because it is difficult to determine mechanisms accounting for these associations, animal studies are useful for studying the fundamental relationships between biological and behavioral traits. Pharmacologic and behavioral studies suggest that infant rat ultrasonic vocalizations (USV) are a measure of an early anxiety-like state related to separation anxiety. However, it was not known whether or not early ultrasound emissions in infant rats are markers for genetic risk for anxiety states later in life. To address these questions, we selectively bred two lines of rats based on high and low rates of USV to isolation at postnatal (P) 10 days of age. To our knowledge, ours is the only laboratory that has ever selectively bred on the basis of an infantile trait related to anxiety. The High and Low USV lines show two distinct sets of patterns of behavior, physiology and neurochemistry from infancy through adulthood. As adults High line rats demonstrate "anxious"/"depressed" phenotypes in behavior and autonomic nervous system (ANS) regulation to standard laboratory tests. In Lows, on the other hand, behavior and autonomic regulation are consistent with an "aggressive" phenotype. The High and Low USV lines are the first genetic animal models implicating long-term associations of contrasting "coping styles" with early attachment responses. They thus present a potentially powerful model for examining gene-environment interactions in the development of life-long affective regulation.
Figures
Similar articles
-
Variations in maternal behavior in rats selected for infant ultrasonic vocalization in isolation.Horm Behav. 2015 Sep;75:78-83. doi: 10.1016/j.yhbeh.2015.08.007. Epub 2015 Aug 22. Horm Behav. 2015. PMID: 26306860
-
Selective breeding for an infant phenotype: rat pup ultrasonic vocalization (USV).Behav Genet. 2005 Jan;35(1):53-65. doi: 10.1007/s10519-004-0855-6. Behav Genet. 2005. PMID: 15674532
-
Developmental effects of selective breeding for an infantile trait: the rat pup ultrasonic isolation call.Dev Psychobiol. 2001 Dec;39(4):231-46. doi: 10.1002/dev.1000. Dev Psychobiol. 2001. PMID: 11745318
-
Development and evolution of hidden regulators: selective breeding for an infantile phenotype.Dev Psychobiol. 2005 Nov;47(3):243-52. doi: 10.1002/dev.20090. Dev Psychobiol. 2005. PMID: 16252292 Review.
-
Pro-social ultrasonic communication in rats: insights from playback studies.J Neurosci Methods. 2014 Aug 30;234:73-81. doi: 10.1016/j.jneumeth.2014.01.023. Epub 2014 Feb 4. J Neurosci Methods. 2014. PMID: 24508146 Review.
Cited by
-
Differential impact of a complex environment on positive affect in an animal model of individual differences in emotionality.Neuroscience. 2013 Sep 17;248:436-47. doi: 10.1016/j.neuroscience.2013.06.015. Epub 2013 Jun 24. Neuroscience. 2013. PMID: 23806722 Free PMC article.
-
Characterizing maternal isolation-induced ultrasonic vocalizations in a gene-environment interaction rat model for autism.Genes Brain Behav. 2023 Jun;22(3):e12841. doi: 10.1111/gbb.12841. Epub 2023 Feb 7. Genes Brain Behav. 2023. PMID: 36751016 Free PMC article.
-
A mouse model of high trait anxiety shows reduced heart rate variability that can be reversed by anxiolytic drug treatment.Int J Neuropsychopharmacol. 2011 Nov;14(10):1341-55. doi: 10.1017/S1461145711000058. Epub 2011 Feb 15. Int J Neuropsychopharmacol. 2011. PMID: 21320392 Free PMC article.
-
Unusual repertoire of vocalizations in the BTBR T+tf/J mouse model of autism.PLoS One. 2008 Aug 27;3(8):e3067. doi: 10.1371/journal.pone.0003067. PLoS One. 2008. PMID: 18728777 Free PMC article.
-
An Epidemiological Contribution to Clinical Understanding of Anxiety.Am J Psychiatry. 2015 Jul;172(7):601-2. doi: 10.1176/appi.ajp.2015.15030312. Am J Psychiatry. 2015. PMID: 26130198 Free PMC article. No abstract available.
References
-
- Agelink MW, Majewski T, Wurthmann C, Postert T, Linka T, Rotterdam S, Klieser E. Autonomic neurocardiac function in patients with major depression and effects of antidepressant treatment with nefazodone. J Affect Disord. 2001 Feb;62(3):187–98. - PubMed
-
- Agelink MW, Boz C, Ullrich H, Andrich J. Relationship between major depression and heart rate variability. Clinical consequences and implications for antidepressant treatment. Psychiatry Res. 2002 Dec 15;113(12):139–49. - PubMed
-
- Ahmadiyeh N, Churchill GA, Shimomura K, Solberg LC, Takashi JS, Redi EE. X-linked and lineage-dependent inheritance of coping responses to stress. Mammal Gen. 2003;14(11):748–757. - PubMed
-
- Allen MT, Matthews KA, Kenyon KL. The relationships of resting baroreflex sensitivity, heart rate variability and measures of impulse control in children and adolescents. Intern J Psychophysiol. 2000;37:185–194. - PubMed
-
- Almeida SS, De Araujo M. Postnatal protein malnutrition affects play behavior and other social interactions in juvenile rats. Physiol Behav. 2001;74:45–51. - PubMed
Publication types
MeSH terms
Grants and funding
LinkOut - more resources
Full Text Sources
Research Materials
