. 2007 Jun;12(6):917-30.
doi: 10.1016/j.devcel.2007.04.002.

Asymmetric CLASP-dependent nucleation of noncentrosomal microtubules at the trans-Golgi network

Affiliations

Asymmetric CLASP-dependent nucleation of noncentrosomal microtubules at the trans-Golgi network

Andrey Efimov et al. Dev Cell. 2007 Jun.

Abstract

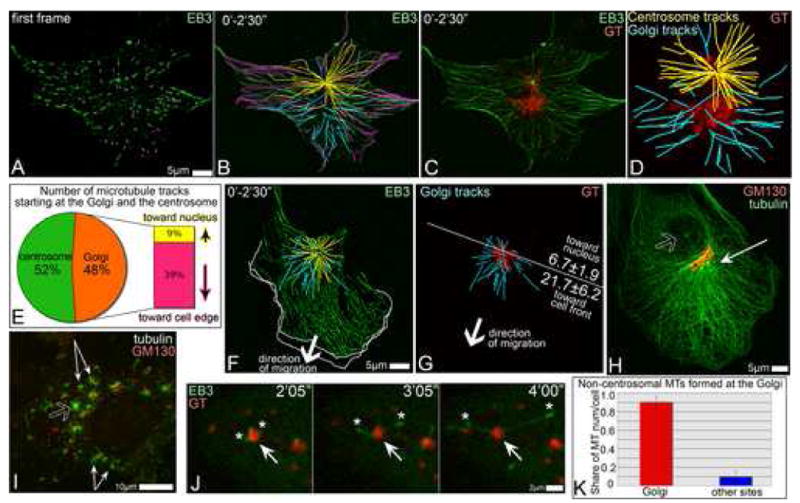
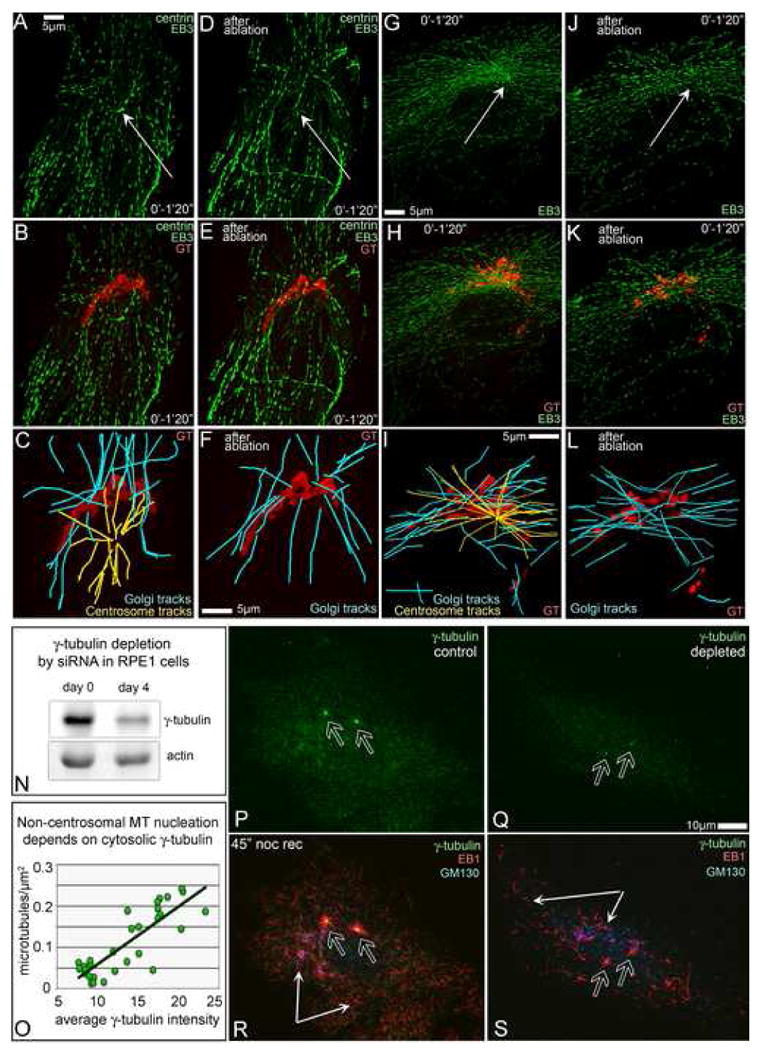
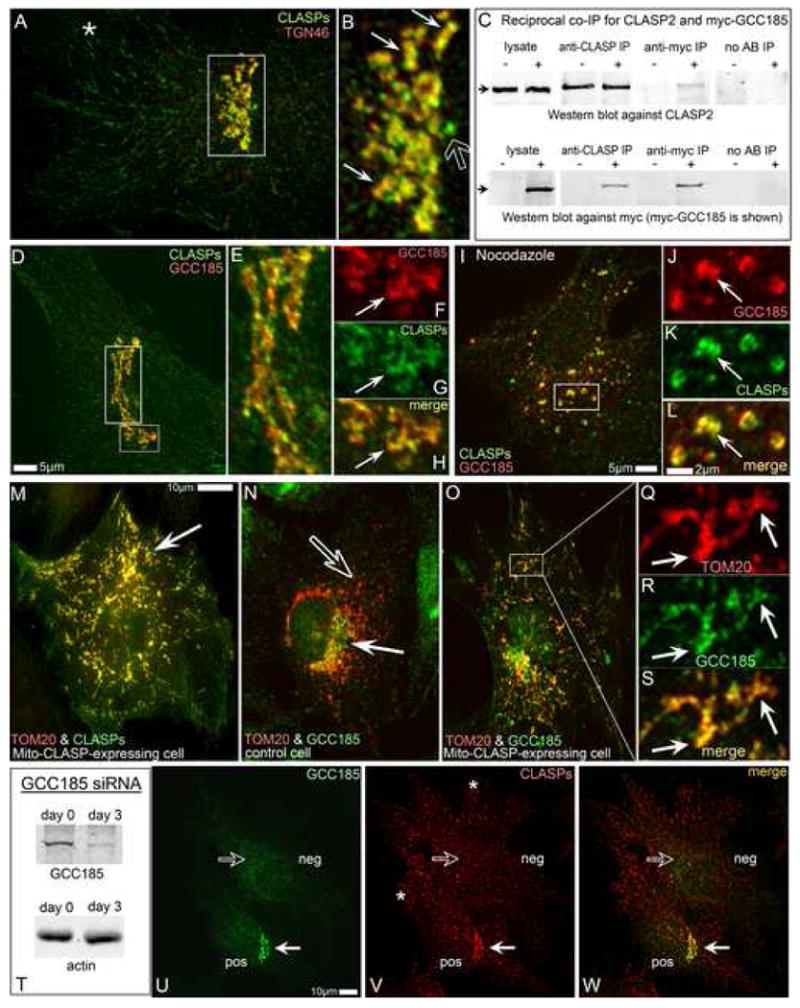
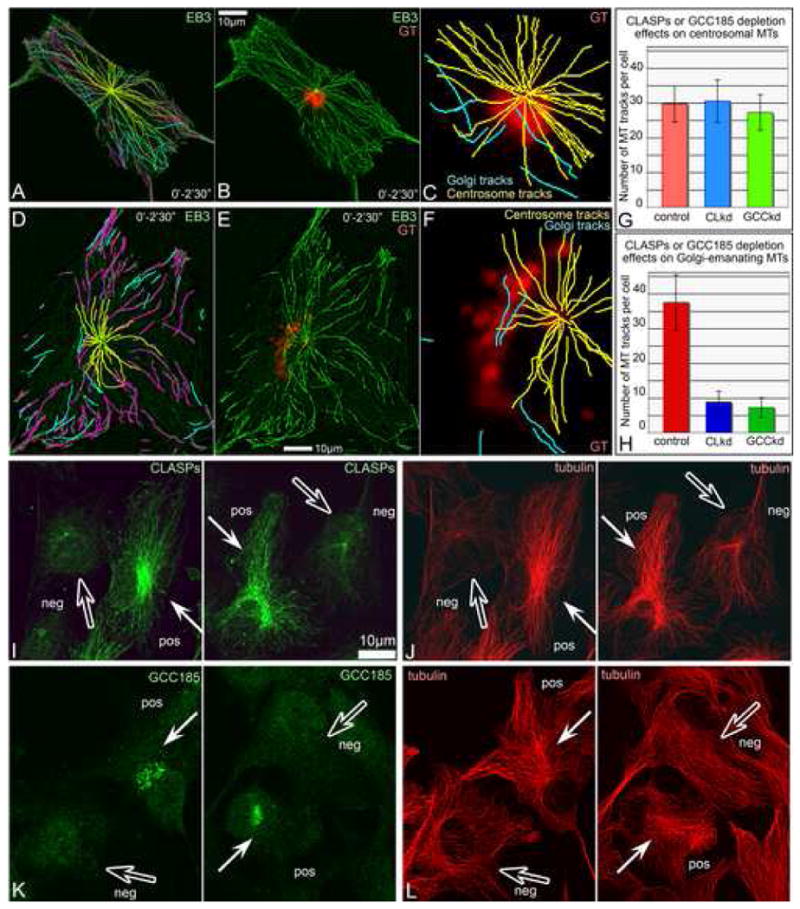
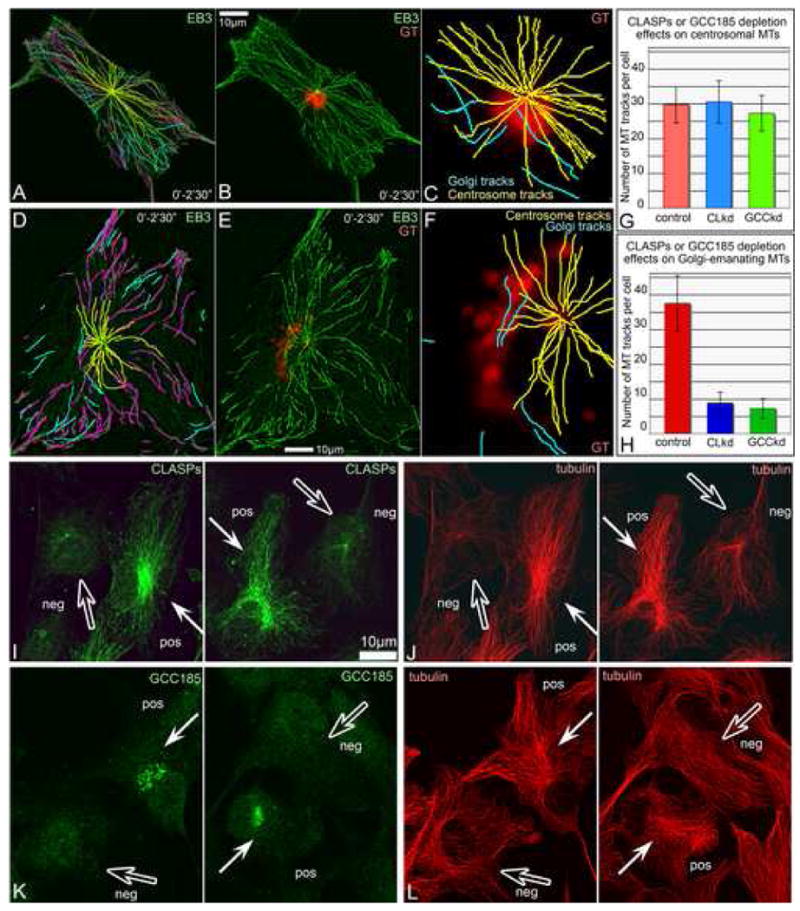
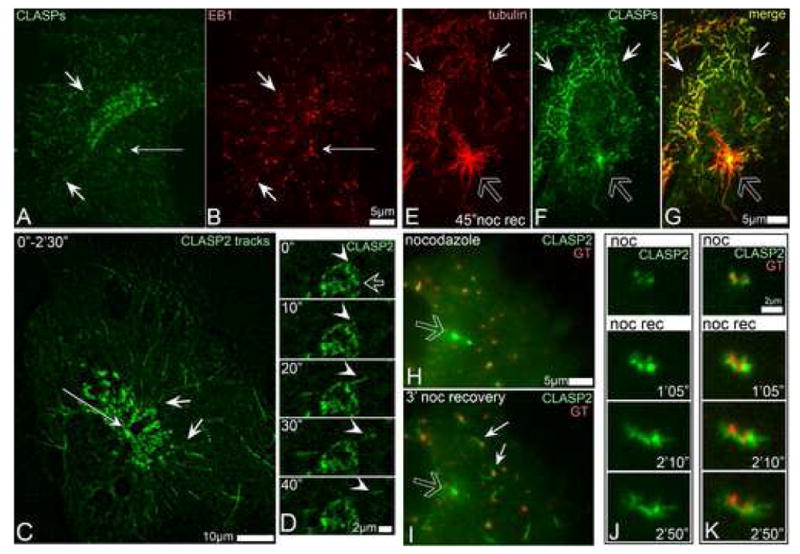
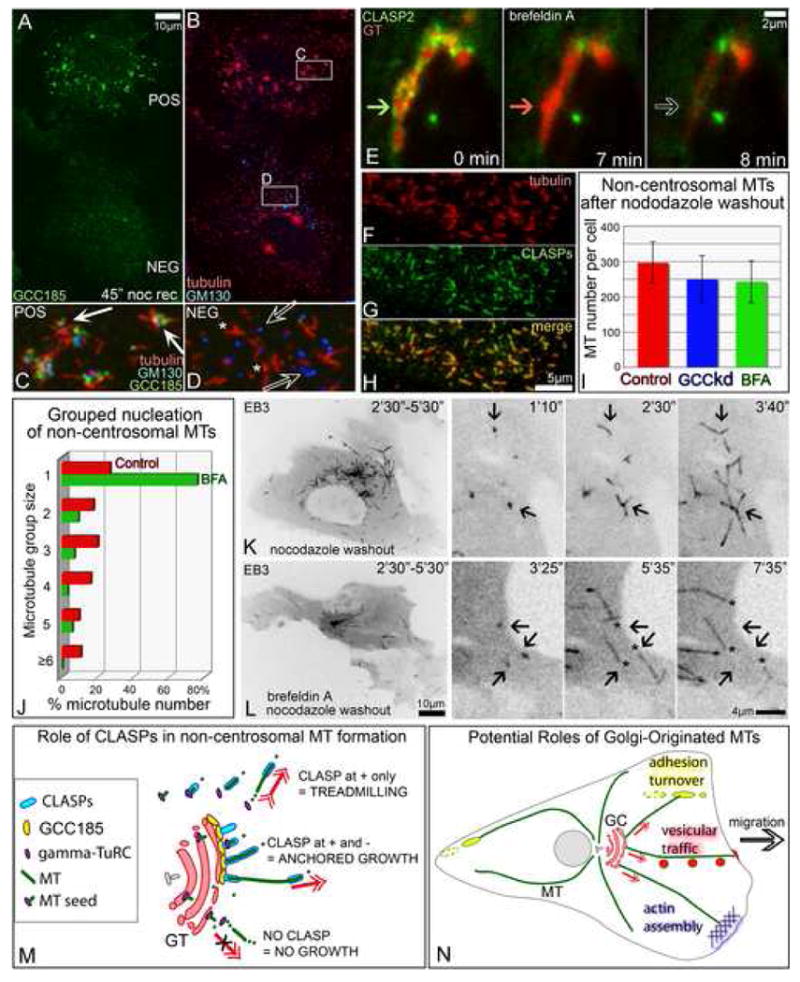
Proper organization of microtubule arrays is essential for intracellular trafficking and cell motility. It is generally assumed that most if not all microtubules in vertebrate somatic cells are formed by the centrosome. Here we demonstrate that a large number of microtubules in untreated human cells originate from the Golgi apparatus in a centrosome-independent manner. Both centrosomal and Golgi-emanating microtubules need gamma-tubulin for nucleation. Additionally, formation of microtubules at the Golgi requires CLASPs, microtubule-binding proteins that selectively coat noncentrosomal microtubule seeds. We show that CLASPs are recruited to the trans-Golgi network (TGN) at the Golgi periphery by the TGN protein GCC185. In sharp contrast to radial centrosomal arrays, microtubules nucleated at the peripheral Golgi compartment are preferentially oriented toward the leading edge in motile cells. We propose that Golgi-emanating microtubules contribute to the asymmetric microtubule networks in polarized cells and support diverse processes including post-Golgi transport to the cell front.


Figures

Fig. 1
Fig. 1. Golgi complex is an additional MTOC
A-D. Detection of Golgi-originated MTs in time lapse recording of GFP-EB3 and mCherry-GT expressing RPE1 cell (5sec/frame). A. GFP-EB3 in the first frame of the video (green). Currently growing MTs are marked by magenta dots. B. Overlaid GFP-EB3 showing MT tracks within 2.5′. Magenta, tracks started at the frame one. Yellow, centrosomal tracks. Cyan, non-centrosomal tracks. C. Overlaid GFP-EB3 (green) and mCherry-GT (red) images within 2.5′. D. centrosomal (yellow) and non-centrosomal (cyan) MT tracks in the cell center and their relation to the Golgi position (GT, red). E. Percentage and directionality of Golgi-associated tracks (583 tracks in 10 cells, analyzed as above). F, G. Directionality of Golgi-associated tracks in a motile cell. Arrows indicate the direction of the cell re-location. F. Overlaid mCherry-EB3 tracks (2.5′, false-colored green). Centrosomal (yellow) and Golgi-associated (cyan) tracks in the cell center are shown. Outlines of the protruding cell front in the first and the last frame of the 5′ video are shown as white lines. G. Golgi (YFP-GT, false-colored red) and associated tracks (cyan). A line is drawn perpendicular to the direction of cell movement. Average number of MTs in 9 cells growing forwards or backwards are shown. H. Prominent MT array (thin arrow) in a polarized cell is rather associated with the Golgi (red) than with the centrosome (hollow arrow). Tubulin (green) and GM130 (red), immunostained. I, RPE1 cell fixed and stained 45″ after nocodazole washout. MTs (green) radiate from the Golgi mini-stacks (thin arrows) and the centrosome (hollow arrow). Tubulin, green. GM130, red. J. Live cell images of nocodazole washout. GFP-EB3-rich plus tips (green, asterisks) grow away from the mCherry-GT-marked Golgi stack (arrow, red). K. Number of non-centrosomal MTs nucleated at the Golgi (red) and elsewhere (blue) after nocodazole washout per cell, based on live recordings of mCherryEB3 and YFP-GT expressing cells (521 MTs in 8 cells).
Fig. 2
Fig. 2. MT nucleation at the Golgi does not require the centrosome but needs γ-tubulin
A-F, GFP-EB3 (green), GFP-centrin (green) and mCherry-GT (red) expressing cell. G-L, GFP-EB3 (green) and mCherry-GT (red) expressing cell. A-C, G-I – cells prior to ablation. D-F, J-L – cells 30 min after ablation. Nucleation sites were analyzed as in Fig. 1 A-D. A,B,C,D, EB3 tracks within 1 min 20 sec. Arrows, centrosomes. B,E,H,K, EB3 tracks (green) superimposed on the Golgi image (GT, red). C,F,I,L, centrosomal (yellow) and non-centrosomal (cyan) MT tracks in the cell center and their relation to the Golgi position (GT, red). Centrosomal but not Golgi-originated arrays disappear after centrosome ablation (F, L). N, 50% depletion of γ-tubulin in RPE1 cells by siRNA. Actin, loading control. O, Number of non-centrosomal MTs directly corresponds to intensity of cytosolic γ-tubulin staining. P-S, Fewer centrosomal (hollow arrows) and non-cnetrosomal (thin arrows) MTs is formed 45″ after nocodazole washout in γ̃–tubulin depleted (Q,S) than in control (P,R) cell. γ-tubulin, green (P-S); EB1, red (R,S); GM130, blue (R,S). Immunostaining.
Fig. 3
Fig. 3. CLASPs specifically localize to TGN membranes via GCC185 binding
A,B, CLASPs (green) co-localize the TGN46 (red, thin arrows in B) along with the MT tips (star in A) and the centrosome (hollow arrow in B). Box in A is enlarged in B. C, Co-IP of CLASP2 and myc-GCC185 using either anti-CLASP2 or anti-myc antibodies. Upper panel, CLASP2. Lower panel, myc-GCC185. Non-transfected cells are marked as “–”, myc-GCC185-transfected cells as “+”. CLASP2 is co-precipitated from transfected cells by anti-myc antibody (Anti-myc IP). Myc-GCC185 is co-precipitated from transfected cells by anti-CLASP antibody (Anti-CLASP IP). Antibody-free beads used as control (No AB IP). D-H, CLASP co-localizes with ectopically expressed myc-tagged GCC185 at the TGN. Myc (red), CLASP (green). E, Enlarged tall box from D. F-H, Enlarged small box from D. F, myc-GCC185. G, CLASP. H, merge. Arrows, reference point. I-L, association of CLASPs and GCC185 is preserved in nocodazole. J-L, Enlarged small box from I. J, myc-GCC185. K, CLASPs. L, merge. Arrow, reference point. M, CLASP2-dTOM20 chimera (mito-CLASP) and mCherry-dTOM20 (red) co-expressing cell. CLASP staining (green) reveals both mito-CLASP (arrow, co-localized with mCherry-dTOM20 at mitochondria) and endogenous CLASPs. N. GCC185 at the Golgi (green, white arrow) does not co-localize with mCherry-dTOM20 at mitochondria (red, hollow arrow) in control cells. O-S. Mito-CLASP expressing cell. Endogenous GCC185 (green) is recruited to mitochondria (mCherry-dTOM20, red). Box is enarged in Q-S. Q, mCherry-dTOM20. R, GCC185. S, merge. Arrows, reference points. T, GCC185 is 90% depleted from RPE1 cells by siRNA. U-W, Mixed culture of GCC185-depleted (neg) and control (pos) cells. U, GCC185. V, CLASPs. W, merge of U and V. CLASP is localized to the Golgi in control cell (white arrow) but not in GCC185-depleted cell (hollow arrow). MT tip colalization of CLASP is intact in both cells (asterrisks). All images show immunostainings.
Fig.4
Fig.4. siRNA CLASP knockdown suppresses MT formation at the Golgi upon nocodazole washout
A, Western blotting illustrating ∼75% decrease of both CLASP1 and CLASP2 on the 3rd day after siRNA transfection as well as expression of non-silenceable GFP-CLASP2. Regions of interest are shown. B. Numbers of non-centrosomal MTs formed 45″ after nocodazole washout in CLASP-positive (red, 30 cells) and CLASP-depleted cells (blue, 30 cells), as well as upon rescue by non-silenceable GFP-CLASP2 (green, 16 cells). Based on tubulin immunostaining. C-F, Mixed culture of CLASP-positive (pos) and CLASP-depleted (neg) cells 45″ after nocodazole washout. Tubulin (red), GM130 (blue), CLASPs (green). Immunostaining. C, In CLASP positive cell, MTs radiate from Golgi stacks (arrows). D, In CLASP-depleted cell, Golgi stacks are not associated with rare MTs (hollow arrows). E, CLASPs and F, MTs and Golgi stacks at low magnification. Boxes enlarged in C and D. G, H. Video frames illustrating MT formation at the Golgi (arrows) in mRFP-EB3 (false-colored green) and YFP-GT (false-colored red) in nocodazole washout. Time after nocodazole removal in shown. Left, frames showing whole cell. Areas in boxes are enlarged to the right. G, Control cell. H, CLASP-depleted cell.
Fig. 5
Fig. 5. Golgi-originated MTs in steady state require CLASPs presence at the TGN
A-C. GFP-EB3 and mCherry-GT-expressing CLASP-depleted cell analyzed as in Fig. 1 AD. A, Overlaid GFP-EB3 showing MT tracks within 2.5′. Magenta, tracks started at the frame one. Yellow, centrosomal tracks. Cyan, non-centrosomal tracks. B, Overlaid GFP-EB3 (green) and mCherry-GT images within 2.5′. C, centrosomal (yellow) and few non-centrosomal (cyan) tracks in the cell center and their relation to the Golgi position. D-F. GFP-EB3 and mCherry-GT-expressing GCC185-depleted cell analyzed as in Fig. 1 A-D. D, Overlaid GFP-EB3 showing MT tracks within 2.5′. Magenta, tracks started at the frame one. Yellow, centrosomal tracks. Cyan, non-centrosomal tracks. E, Overlaid GFP-EB3 (green) and mCherry-GT images within 2.5′. C, centrosomal (yellow) and few non-centrosomal (cyan) tracks in the cell center and their relation to the Golgi position. G, No alteration of centrosomal MT tracks upon CLASP (CLkd, blue) or GCC185 (GCCkd, green) knockdown. H, Decrease in Golgi-associated MT track number upon CLASP (CLkd, blue) or GCC185 (GCCkd, green) knockdown. I-J, CLASPs (I) and MTs (J) in mixed culture of CLASP-positive (white arrows) and CLASP-depleted (hollow arrows) cells. K-L, GCC185 (K) and MTs (L) in mixed culture of control (white arrows) and GCC185-depleted (hollow arrows) cells. CLASP or GCC185-depleted cells lack Golgi-associated MT array. Immunostainings.
Fig. 6
Fig. 6. CLASPs preferentially bind to MTs originated at the Golgi
A, CLASPs (green) in RPE1 cells are associated with MT tips close to the Golgi (short arrows), but not around the centrosome (thin arrow). B, EB1 (red) at the MT tips in the cell shown in G. Immunostaining. C, Overlaid live recording of GFP-CLASP2-expressing RPE1 cell within 2.5 min. CLASP2-associated MT tracks (short arrows) radiate from the TGN but not form the centrosome (thin arrow). D, Live sequence illustrating formation of GFP-CLASP2-decorated MT (arrowhead) at CLASP-rich TGN (hollow arrow) in untreated cell. CLASP2 coats whole newly formed MT (10″-20″) but remains only at the tip at a later stage (30″-40″). E-G, A cell fixed 45″ after nocodazole washout. E, tubulin (red). F, CLASPs (green). G, Merge. CLASPs localize to non-centrosomal (white arrows) but not to the centrosomal (hollow arrow) MTs. H-I, GFP-CLASP2 (green) localizations before and after nocodazole washout. In nocodazole (left) CLASP2 associate with Golgi stacks (mCherry-GT, red) and with the centrosome (hollow arrow). 3′ after nocodazole removal (right) CLASP2 is detected at the Golgi-associated MTs (white arrows) but not around the centrosome (hollow arrow). J-K, Video frames illustrating formation of GFP-CLASP2-coated MTs at GFP-CLASP2-enriched Golgi stacks in nocodazole washout. J, GFP-CLASP2. K, GFP-CLASP2 (green) and mCherry-GT (red). Time after nocodazole removal is shown.
Fig. 7
Fig. 7. CLASPs dissolved in the cytosol support MT nucleation but not minus end anchoring
A-D. Mixed culture of GCC185-positive (pos) and GCC185-depleted (neg) cells 45″ after nocodazole washout. Boxes from B enlarged in C and D. GCC185 (green, A,C,D). Tubulin (red, B-D). GM130, (Blue B-D). C, In a control cell, MTs grow from the Golgi stacks. D, In GCC185-depleted cell, Golgi stacks (hollow arrows)are not associated with random single MTs (asterisks). E. In brefeldin A, GFP-CLASP2 (green) dissociates from the Golgi (7′) prior to Golgi-ER fusion (8′). Fusion is visualized by acute loss of mCherry-GT signal (red). Arrow hue illustrates presence of proteins. Time in brefeldin A is shown. F-H, In brefeldin A, CLASPs coat non-centrosomal MTs formed 45″ after nocodazole washout. F, tubulin. G, CLASPs. H, merge. Immunostaining. I, MTs formed in control (red), GCC185-depleted (GCCkd, blue) and Brefeldin A-treated (BFA, green) cells 45″ after nocodazole washout. For each set, 30 cells immunostained for tubulin were analyzed. J, Number of MTs nucleated singly and in groups after nocodazole washout with (BFA, green) and without (red) Brefeldin A. Live recordings of 7 mCherry-EB3-expressing cells for each set were analyzed. K-L. Non-centrosomal MTs in GFP-EB3-expressing RPE cells. Inverted images. Left, EB3 tracks within 3′. Right, enlarged inset video frames. Time after nocodazole removal is shown. K, In a control cell, MTs grow from distinct centers (arrows). L, In brefeldin A treated cell, minus ends of single MTs (asterisks) do not remain at the nucleation sites (arrows). M. Model for mechanisms of CLASP-dependent MT formation. γ-tubulin nucleates MT seeds in cytosol or at the Golgi. Cytoplasmic CLASPs associate with the MT plus end and support polymerization while minus end is unstable and depolymerizes resulting in MT treadmilling (top). CLASPs bound to TGN via GCC185 coat MT portion proximal to the minus end, anchor it to the membrane and prevent it's depolymerization, while CLASP-associated plus end steadily grows (middle). In the absence of CLASPs, MT seeds are unstable (bottom). GC, Golgi complex. N, Potential roles of Golgi-originated MTs in cell migration (model). Front-oriented MTs likely support post-Golgi vesicular trafficking (red), actin polymerization (blue) and focal adhesion turnover behind the leading edge (yellow).

Comment in

References

    1. Akhmanova A, Hoogenraad CC, Drabek K, Stepanova T, Dortland B, Verkerk T, Vermeulen W, Burgering BM, De Zeeuw CI, Grosveld F, Galjart N. Clasps are CLIP-115 and -170 associating proteins involved in the regional regulation of microtubule dynamics in motile fibroblasts. Cell. 2001;104:923–935. - PubMed
    1. Bacallao R, Antony C, Dotti C, Karsenti E, Stelzer EH, Simons K. The subcellular organization of Madin-Darby canine kidney cells during the formation of a polarized epithelium. J Cell Biol. 1989;109:2817–2832. - PMC - PubMed
    1. Bartolini F, Gundersen GG. Generation of noncentrosomal microtubule arrays. J Cell Sci. 2006;119:4155–4163. - PubMed
    1. Bergen LG, Kuriyama R, Borisy GG. Polarity of microtubules nucleated by centrosomes and chromosomes of Chinese hamster ovary cells in vitro. J Cell Biol. 1980;84:151–159. - PMC - PubMed
    1. Bugnard E, Zaal KJ, Ralston E. Reorganization of microtubule nucleation during muscle differentiation. Cell Motil Cytoskeleton. 2005;60:1–13. - PubMed

Publication types