. 2007 Feb;245(2):91-102.
doi: 10.1016/j.cellimm.2007.04.004. Epub 2007 Jun 1.

Cellular immune response to an engineered cell-based tumor vaccine at the vaccination site

Affiliations

Cellular immune response to an engineered cell-based tumor vaccine at the vaccination site

Qiang Zhou et al. Cell Immunol. 2007 Feb.

Abstract

The engineered expression of the immune co-stimulatory molecules CD80 and CD137L on the surface of a neuroblastoma cell line converts this tumor into a cell-based cancer vaccine. The mechanism by which this vaccine activates the immune system was investigated by capturing and analyzing immune cells responding to the vaccine cell line embedded in a collagen matrix and injected subcutaneously. The vaccine induced a significant increase in the number of activated CD62L(-) CCR7(-) CD49b(+) CD8 effector memory T cells captured in the matrix. Importantly, vaccine responsive cells could be detected in the vaccine matrix within a matter of days as demonstrated by IFN-gamma production. The substitution of unmodified tumor cells for the vaccine during serial vaccination resulted in a significant decrease in activated T cells present in the matrix, indicating that immune responses at the vaccine site are a dynamic process that must be propagated by continued co-stimulation.


Figures
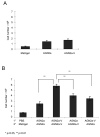
Figure 1
Figure 1. Total Cells Captured in Matrigel Plugs
Mice were injected s.c. with Matrigel-containing the cell-based vaccine AGN2a-V (primary vaccine), or with AGN2a-V in PBS followed one week later by AGN2a-V in Matrigel (secondary vaccine). The experimental groups are listed in Table 1. Mice were sacrificed and Matrigel plugs recovered 6 days after primary (A) or 6 days after secondary (B) immunization. Matrigel plugs were cut into small pieces, digested for one hour with collagenase and DNAse, and then pressed through a sterile tissue culture screen. Viable cells were collected, washed, and then counted using trypan blue exclusion, as detailed in Methods. Each bar represents the average cell number (± standard deviation) from groups of five mice treated as indicated on the x-axis. This experiment is representative of three separate experiments. Significant differences, **p< 0.01, between groups in the secondary vaccination experiment are noted.
Figure 2
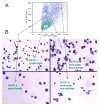
Figure 2. Flow Cytometric Analysis of Matrix-Infiltrating Cells
The greatest number of cells infiltrating the matrix were captured when AGN2a-V was given twice (Group 3, Secondary Vaccine Protocol, Table 1, and also Figure 1). As in Figure 1, mice were injected s.c. with vaccine in PBS, followed one week later with vaccine in Matrigel, and the plugs harvested six days later. Panel (A) shows a representative flow cytometry forward-scatter by side-scatter analysis of the total cellular infiltrate collected from a Matrigel plug harvested 6 days after the secondary injection of AGN2a-V. Four regions were electronically gated by flow cytometry as shown, cell populations collected by flow cytometric cell sorting, and cells collected from each gate centrifuged on to a glass slide using a Cytospin centrifuge, and then Wright stained. (B) Photomicrographs, 400x, of slides from each gated cell population illustrates the ability to capture viable cells with differential morphologies in Matrigel.
Figure 3
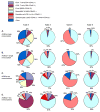
Figure 3. Phenotype of Matrix-Infiltrating Lymphocytes
Mice were injected s.c. with AGN2a-V or unmodified AGN2a in Matrigel and plugs harvested 6 days later (rows A and B, single immunization) or immunized with vaccine or AGN2a in PBS, re-immunized a week later with vaccine or AGN2a in Matrigel, and plugs harvested six days later (rows C and D, two immunizations). Infiltrating cells were collected, viable cells counted, and then stained for the expression of phenotypic markers and analyzed by flow cytometry using antibody specific for the antigens listed in the figure, as detailed in Methods. The percentages of CD4 (CD4+ CD45+, periwinkle blue) and CD8 lymphocytes (CD8+ CD45+, maroon), B cells (B220+ CD45+, tan), monocyte/macrophages (F4/80+ CD45+, light blue), dendritic cells (CD11c+ class II MHC+ CD45+, purple), and granulocytes (Ly6G+ class II MHC CD45+, salmon) present in each of the four electronic gates described in Figure 2 is illustrated following primary (rows A, B) or secondary immunization (rows C, D). The majority of cells in gate 1 are B and T lymphocytes, the majority of cells in gate 2 and gate 4 are monocyte/macrophages, and the majority of cells in gate 3 are granulocytes.
Figure 4
Figure 4. Total CD4 and CD8 Cell Matrix Infiltrate
Mice were immunized s.c. according to the experimental groups listed in Table 1 and cells infiltrating the Matrigel plugs analyzed as described in Figure 1. The total numbers of CD8+ CD45+ cells (A, B) and CD4+ CD45+ cells (C, D) captured in Matrigel plugs 6 days after primary (A, C) or secondary immunization (B, D) were calculated by determining the total number of cells infiltrating the plug and multiplying this number by the fractional percentage of those cells expressing the indicated phenotypic markers, as determined by flow cytometry. The x-axis lists the treatment groups. Values plotted are the average number obtained (± standard deviation) in three separate experiments. Each experiment included 5 mice for each condition. *p<0.05 (Figure 4A, C), or **p<0.01 (B, D).
Figure 5
Figure 5. Draining Lymph Node Numerical Analysis
Mice were immunized s.c. with AGN2a-V or AGN2a according to the experimental groups listed in Table 1, sacrificed 6 days later, and the lymph node draining the immunization site harvested, passed through a 0.1 mm tissue culture screen, viable cells counted, and the cells stained with antibody for the indicated phenotypic markers and analyzed by flow cytometry. The percentages of CD8+ and CD4+ T cells in the vaccine draining lymph nodes were analyzed after primary (A) and secondary immunization (B). Each bar represents the average cell number (± standard deviation) from three experiments. Each experimental group was comprised of 5 mice. There is no significant difference between the percentages of CD8+ and CD4+ lymphocytes in the different treatment protocol groups.
Figure 6
Figure 6. Vaccine Site Infiltrating Lymphocyte Subtypes, Numerical and Activation State Analysis
As in Figure 1, mice were immunized s.c. and cells infiltrating the Matrigel plug collected and analyzed by flow cytometry. The numbers of VLA-2+ and CD69+ T cells captured in Matrigel plugs were calculated based on total infiltrating cell numbers and flow cytometric phenotype analysis. (A) Phenotype and number of T lymphocytes captured after primary vaccination (see Table 1, Matrigel matrix only, open bars; AGN2a in matrix, gray bars; AGN2a-V in matrix, black bars). (B) Phenotype and number of T lymphocytes captured after secondary immunization (see Table 1, PBS followed by matrix, open bars; AGN2a in PBS followed by AGN2a in matrix, gray bars; AGN2a-V in matrix followed by AGN2a-V in matrix, black bars; AGN2a in PBS followed by AGN2a-V in matrix, diagonal striped bars; AGN2a-V in PBS followed by AGN2a-V in matrix, spotted filled bars). Statistical differences, **p<0.01 or *p<0.05, between the highest and next highest group are shown. Averages (± standard deviations) and group sizes are depicted as in Figure 4.
Figure 7
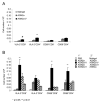
Figure 7. Vaccine Site Lymphocyte Subtypes, Numerical and Memory Marker Analysis
As in Figure 6, the number of lymphocytes captured in Matrigel plugs were counted, and phenotypic analysis of CD8 cells expressing CD62L and CCR7 were determined by flow cytometry. (A) Phenotype and number of lymphocytes captured after primary vaccination (see Table 1, Matrigel matrix only, open bars; AGN2a in matrix, gray bars; AGN2a-V in matrix, black bars). (B) Phenotype and number of T cells captured after secondary immunization (see Table 1, PBS followed by matrix, open bars; AGN2a in PBS followed by AGN2a in matrix, gray bars; AGN2a-V in matrix followed by AGN2a-V in matrix, black bars; AGN2a in PBS followed by AGN2a-V in matrix, diagonal gray striped bars; AGN2a-V in PBS followed by AGN2a-V in matrix, diagonal white striped bars). Averages (± standard deviations) and group sizes are as in Figure 4. Statistical differences, *p<0.05 or **p<0.01, between the highest and next highest group are shown.
Figure 8
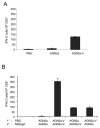
Figure 8. Functional Analysis of Lymphocytes Infiltrating the Vaccine Site
Mice were immunized according to the experimental groups in Table 1 and CD8+ cells isolated from harvested Matrigel plugs using immunomagnetic sorting, as described in Methods. 105 CD8 cells, collected from Matrigel plugs 5 days after primary (A) or secondary (B) immunization, were evaluated by ELISPOT analysis for tumor-induced production of IFN-gamma using unmodified AGN2a tumor cells as the stimulator. Each bar represents the average number (± standard deviation) of IFN-gamma-producing CD8+ T cells from triplicate wells. The experiment is representative of three separate experiments in which matrix-derived cells were pooled from 5 individual mice. In (A) AGN2a-V differs from the other 2 groups, p<0.01. In (B) mice receiving primary and secondary AGN2a-V differ from all other groups, p<0.01, and mice receiving AGN2a/AGN2a-V or AGN2a-V/AGN2a, differ from those receiving AGN2a/AGN2a or Matrigel matrix alone, p<0.01.

Similar articles

Cited by

References

    1. Matthay KK, Villablanca JG, Seeger RC, Stram DO, Harris RE, Ramsay NK, Swift P, Shimada H, Black CT, Brodeur GM, Gerbing RB, Reynolds CP. New Engl J Med. 1999;341:1165–1173. - PubMed
    1. Johnson BD, Gershan JA, Natalia N, Zujewski H, Weber JJ, Yan X, Orentas RJ. J Immunother. 2005;28:449–460. - PubMed
    1. Johnson BD, Yan X, Schauer DW, Orentas RJ. Cell Immunol. 2003;222:15–26. - PubMed
    1. Yan X, Johnson BD, Orentas RJ. Immunol. 2004;112:105–116. - PMC - PubMed
    1. Corthay A, Skovseth DK, Lundin KU, Røsjø E, Omholt H, Hofgaard PO, Haraldsen G, Bogen B. Immunity. 2005;22:371–383. - PubMed

Publication types

MeSH terms