. 2007 Jul 27;370(5):856-69.
doi: 10.1016/j.jmb.2007.04.076. Epub 2007 May 8.

Conservation and diversity among the three-dimensional folds of the Dicistroviridae intergenic region IRESes

Affiliations

Conservation and diversity among the three-dimensional folds of the Dicistroviridae intergenic region IRESes

Jennifer S Pfingsten et al. J Mol Biol. .

Abstract

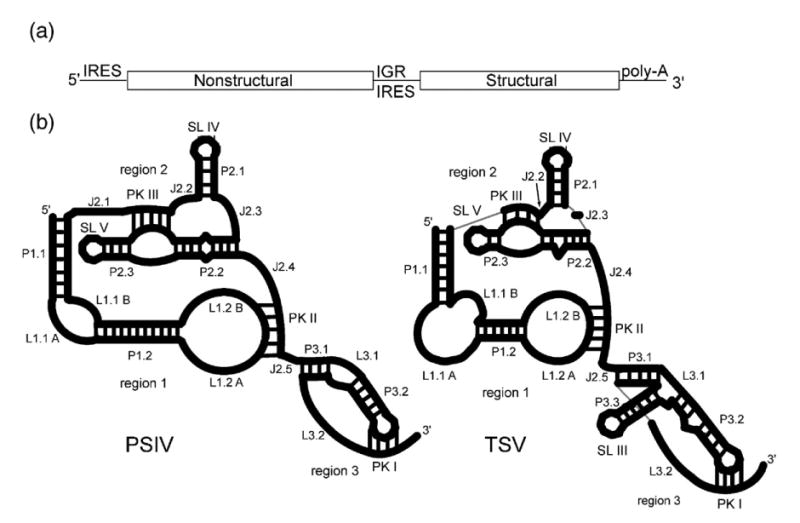
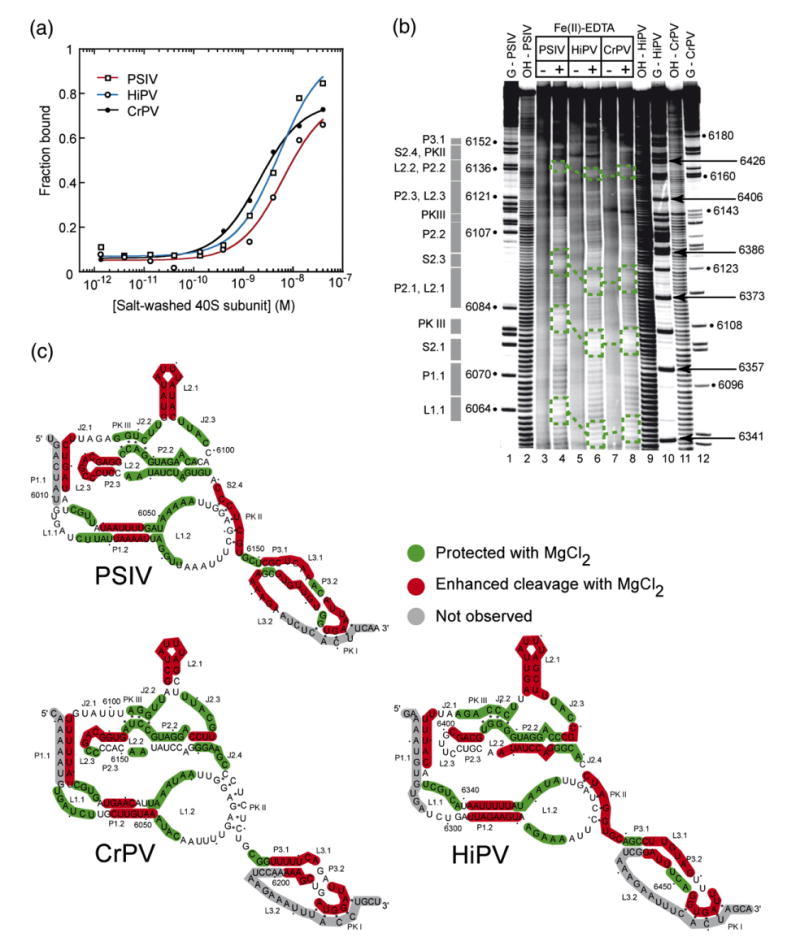
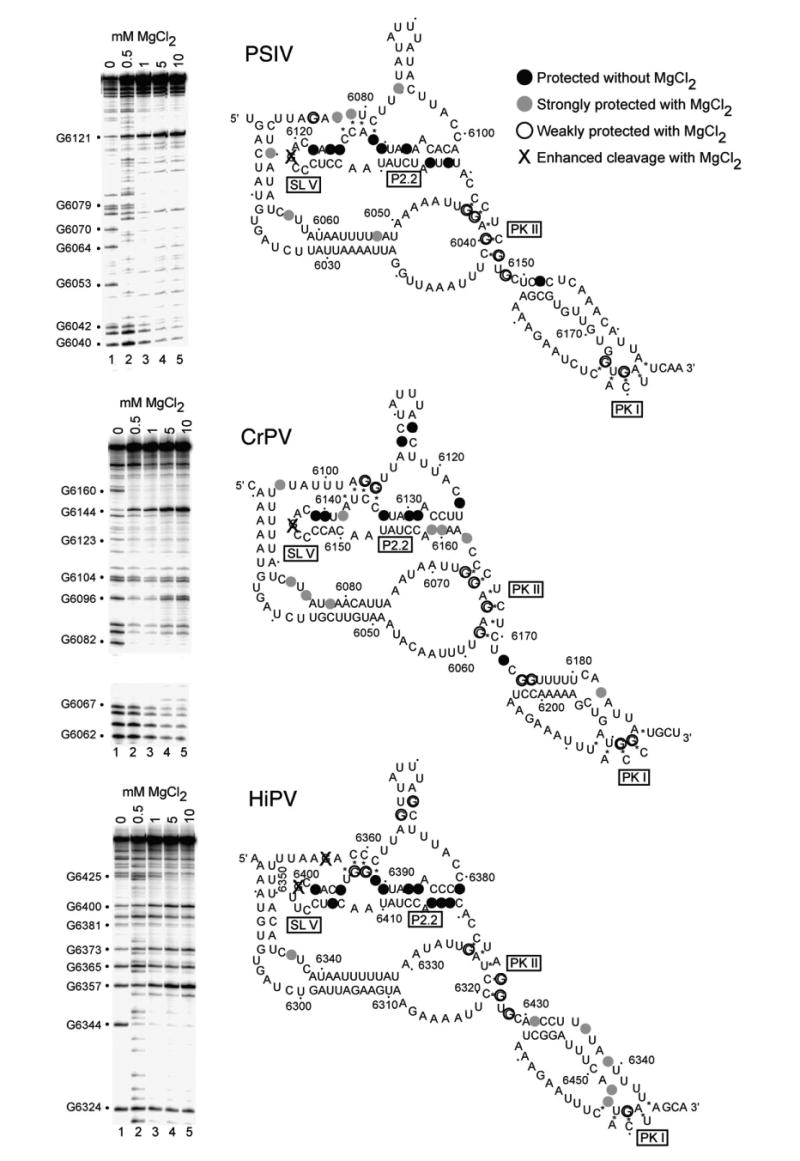
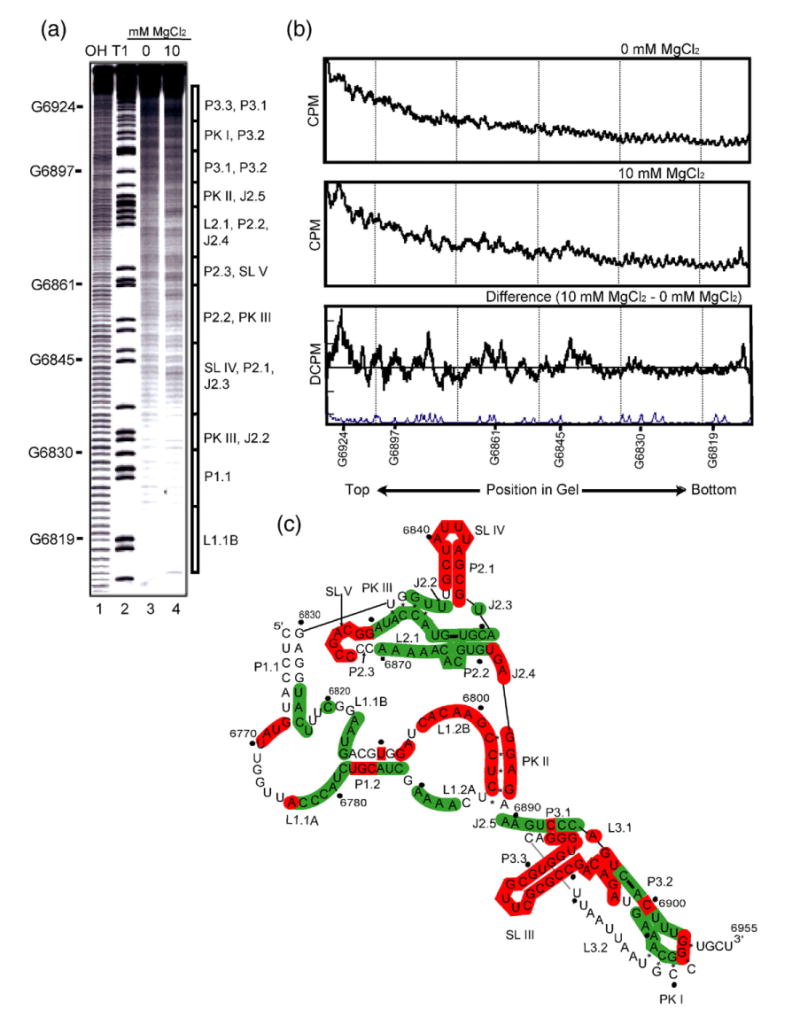
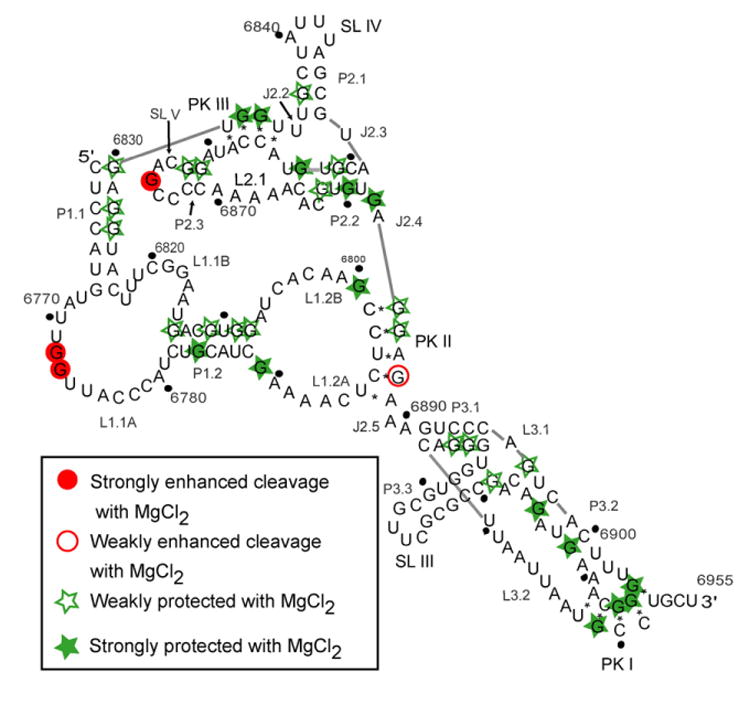
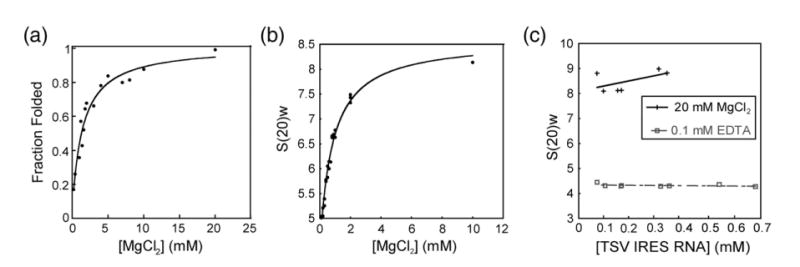
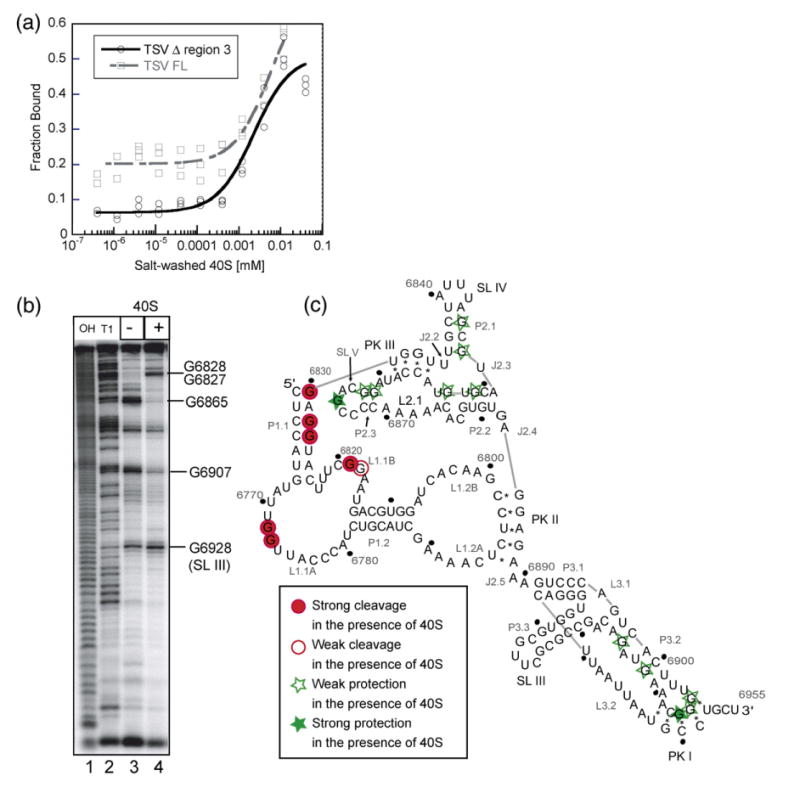
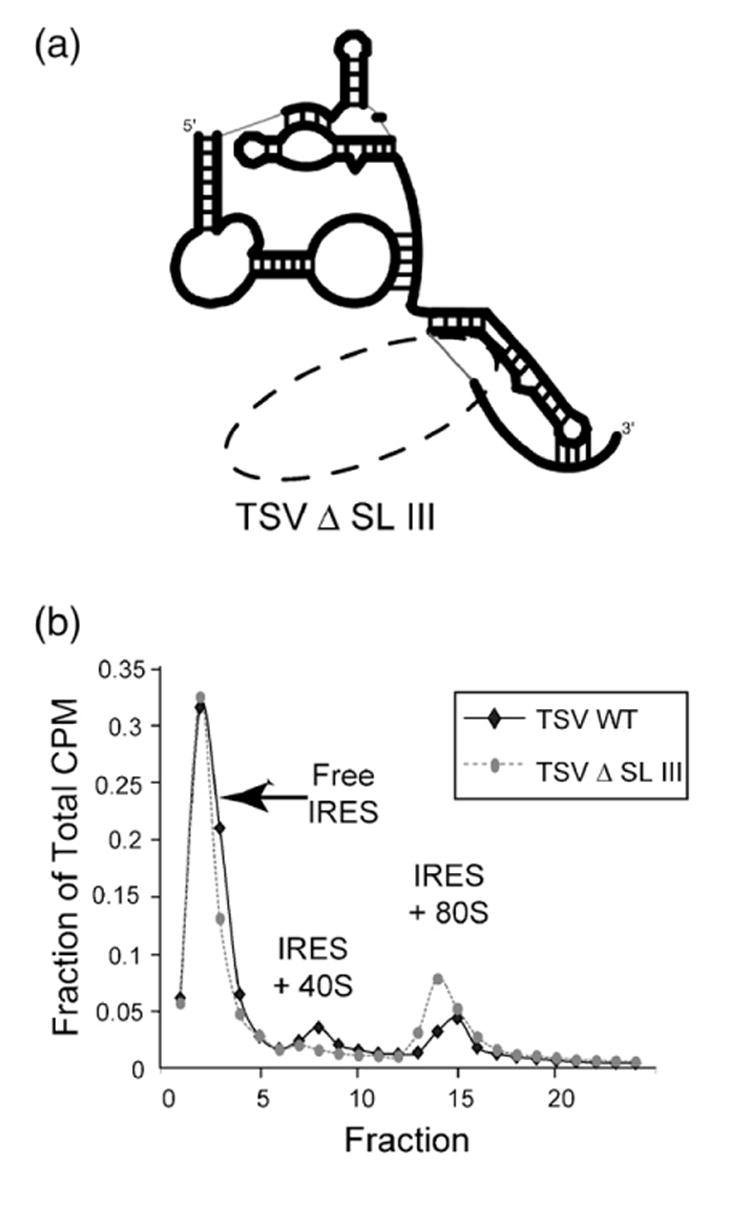
Internal ribosome entry site (IRES) RNAs are necessary for successful infection of many pathogenic viruses, but the details of the RNA structure-based mechanism used to bind and manipulate the ribosome remain poorly understood. The IRES RNAs from the Dicistroviridae intergenic region (IGR) are an excellent model system to understand the fundamental tenets of IRES function, requiring no protein factors to manipulate the ribosome and initiate translation. Here, we explore the architecture of four members of the IGR IRESes, representative of the two divergent classes of these IRES RNAs. Using biochemical and structural probing methods, we show that despite sequence variability they contain a common three-dimensional fold. The three-dimensional architecture of the ribosome binding domain from these IRESes is organized around a core helical scaffold, around which the rest of the RNA molecule folds. However, subtle variation in the folds of these IRESes and the presence of an additional secondary structure element suggest differences in the details of their manipulation of the large ribosomal subunit. Overall, the results demonstrate how a conserved three-dimensional RNA fold governs ribosome binding and manipulation.


Figures

Figure 1
Figure 1
The Dicistroviridae virus genome and IGR IRES secondary structures. (a) The Dicistroviridae genome contains two cistrons on a single positive-sense RNA. The synthesis of the proteins from each cistron is governed by an IRES. The IRES, located between the two cistrons (intergenic region or IGR), is subdivided into two classes. (b) Cartoon representations of the two classes of IGR IRESes, drawn to scale relative to one another. The PSIV IGR IRES represents a typical class 1 IGR IRES while TSV represents a typical class 2 IGR IRES. Here, we use a detailed nomenclature to distinguish between various elements in the IRES structure. Nomenclature used to name the various structural elements follows standard RNA structure usage (J, junction; P, paired/helix; L, loop). SL III, IV, V, and the pseudoknots are also referred to with their traditional names. Furthermore, we reserve the term “domain” for folded into a higher-order structure, and collections of related secondary structures that may or may not adopt a higher-order fold are referred to as “regions.”
Figure 2
Figure 2
Small ribosomal subunit binding affinity comparison and structural comparison of class 1 IGR IRESes. (a) Binding isotherms of purified 40 S subunit to PSIV, CrPV, and HiPV IRES RNAs (a single experiment is shown) obtained from filter binding in a buffer containing 2.5 mM Mg2+ and 300 mM K+. These conditions minimize non-specific binding which occurs between purified ribosomes and RNA, and were chosen to match previous quantitative binding assays. (b) Example of a hydroxyl radical probing experiment of the PSIV (lanes 3 and 4), CrPV (lanes 7 and 8), and HiPV (lanes 5 and 6) IRES RNAs. A few examples of regions of the backbone protected in all three IRES RNAs are indicated with boxes. Repeating this experiment with different gel run times and quantitative analysis of the resulting gels led to a mapping of most of the RNA backbone. (c) Hydroxyl radical cleavage pattern for all three IRESes mapped onto their secondary structures.
Figure 3
Figure 3
RNase T1 probing of the PSIV, CrPV, and HiPV IGR IRES RNAs. The gels shown on the left are examples of the data, in which the backbone was subjected to partial cleavage by RNase T1 (which cleaves after single-stranded G bases). Each gel contains a magnesium titration. At right are the results of this and other gels mapped onto the secondary structure of each IRES RNA. We did not obtain data for the entire backbone, but concentrated on the regions shown to be most structured in the crystal, especially the P2.2 helix and regions that interact with that helix. Bases that were protected from cleavage even in the absence of added magnesium are colored black. Those that were protected at low magnesium concentrations (0.5–1.0 mM) are indicated with filled gray circles. Bases that required elevated magnesium concentrations (5 mM–10 mM) are shown with open circles, and those that became hypersensitive to the enzyme when magnesium was added are shown with an X.
Figure 4
Figure 4
Hydroxyl radical probing of TSV full length IGR IRES. (a) An example of a hydroxyl radical probing experiment performed on 5′ end-labeled TSV full length IRES. Lanes 1 and 2 contain a hydrolysis ladder and an RNase T1 ladder, respectively. On the right of the gel, a schematic shows the location of various secondary structure elements. Lanes 3 and 4 show the TSV IRES hydroxyl radical cleavage pattern in the absence or presence of MgCl2, respectively. These lanes were analyzed as described. (b) Normalized quantified traces of lanes 3 and 4, and the difference trace shown with a trace of the RNase T1 lane. (c) Summary of all the hydroxyl radical probing data of the TSV IRES RNA. Solvent accessible or exposed regions of the backbone are colored red on the secondary structure, and protected or solvent inaccessible are colored green.
Figure 5
Figure 5
RNase T1 probing on the TSV IRES showing the cleavage pattern that resulted when the IRES was allowed to fold in the presence of MgCl2. Filled circles indicate that the G base was strongly protected from the RNase upon the addition of the cation. Open circles represent G bases that were weakly protected. Open stars are indicative of G bases that were weakly cleaved more in the presence of the cation. Filled stars depict G bases that were strongly cleaved in the presence of the Mg2+ cation.
Figure 6
Figure 6
Folding of the TSV IRES as a function of MgCl2. (a) Graph of hydroxyl radical probing of full length TSV IRES RNA with varying concentrations of MgCl2. The plot shows fraction folded versus [MgCl2], fitted by a Langmuir isotherm. (b) Graph of sedimentation coefficient of the full-length TSV IRES RNA as a function of the concentration of MgCl2. (c) Graph of sedimentation coefficient of the full-length TSV IRES RNA at several [RNA], both in the absence and presence of MgCl2. These plots indicate no significant deviations from ideality that would affect our interpretation. The continuous line represents the 20 mM MgCl2 and the broken line represents 0.1 mM EDTA.
Figure 7
Figure 7
Binding of the small ribosomal subunit to the TSV IRES. (a) Fraction of TSV IRES bound plotted as a function of the small ribosomal subunit concentration. The broken line represents the wild-type and the solid line represents the mutant IRES. (b) A representative RNase T1 footprinting gel, in the absence (lane 3) and presence (lane 4) of 40 S ribosomal subunit. Lanes 1 and 2 are the hydrolysis ladder and RNase T1 ladder, respectively. Selected G residues are labeled to the right of the gel. (c) Footprinting results mapped on the secondary structure. Dark grey circles indicate that a G base was strongly cleaved when the small ribosome subunit was present. Light grey circles indicate that a G base was weakly cleaved when the small ribosome subunit was present. Light grey stars represent the weak protection offered by the 40 S subunit, while the dark grey stars represent G bases that were strongly protected.
Figure 8
Figure 8
Ribosome assembly assay of TSV and a mutant lacking SL 3. (a) Schematic cartoon representation of the TSV IRES RNA mutant used in the assay; the broken oval shows where SL III has been removed. (b) Traces from the ribosome assembly assay with full-length TSV IRES RNA and the SL III deletion mutant. The profiles are plotted based on the percentage of the total counts per minute (CPM) in each fraction. Full-length is represented by a bold black line, while the mutant is represented by a broken line.

References

    1. Jang SK. Internal initiation: IRES elements of picornaviruses and hepatitis c virus. Virus Res. 2006;119:2–15. - PubMed
    1. Hellen CU, Sarnow P. Internal ribosome entry sites in eukaryotic mRNA molecules. Genes Dev. 2001;15:1593–1612. - PubMed
    1. Stoneley M, Willis AE. Cellular internal ribosome entry segments: structures, trans-acting factors and regulation of gene expression. Oncogene. 2004;23:3200–3207. - PubMed
    1. Hershey JWB, Merrick WC. Pathway and mechanism of initiation of protein synthesis. In: Sonenberg N, Hershey JWB, Mathews MB, editors. Translational Control of Gene Expression. Cold Spring Harbor Laboratory Press; Cold Spring Harbor, NY: 2000. pp. 33–88.
    1. Kapp LD, Lorsch JR. The molecular mechanics of eukaryotic translation. Annu Rev Biochem. 2004;73:657–704. - PubMed

LinkOut - more resources