. 2007 Jun 29;147(2):354-72.
doi: 10.1016/j.neuroscience.2007.03.010. Epub 2007 Jun 4.

Glutamate receptor abnormalities in the YAC128 transgenic mouse model of Huntington's disease

Affiliations

Glutamate receptor abnormalities in the YAC128 transgenic mouse model of Huntington's disease

C L Benn et al. Neuroscience. .

Abstract

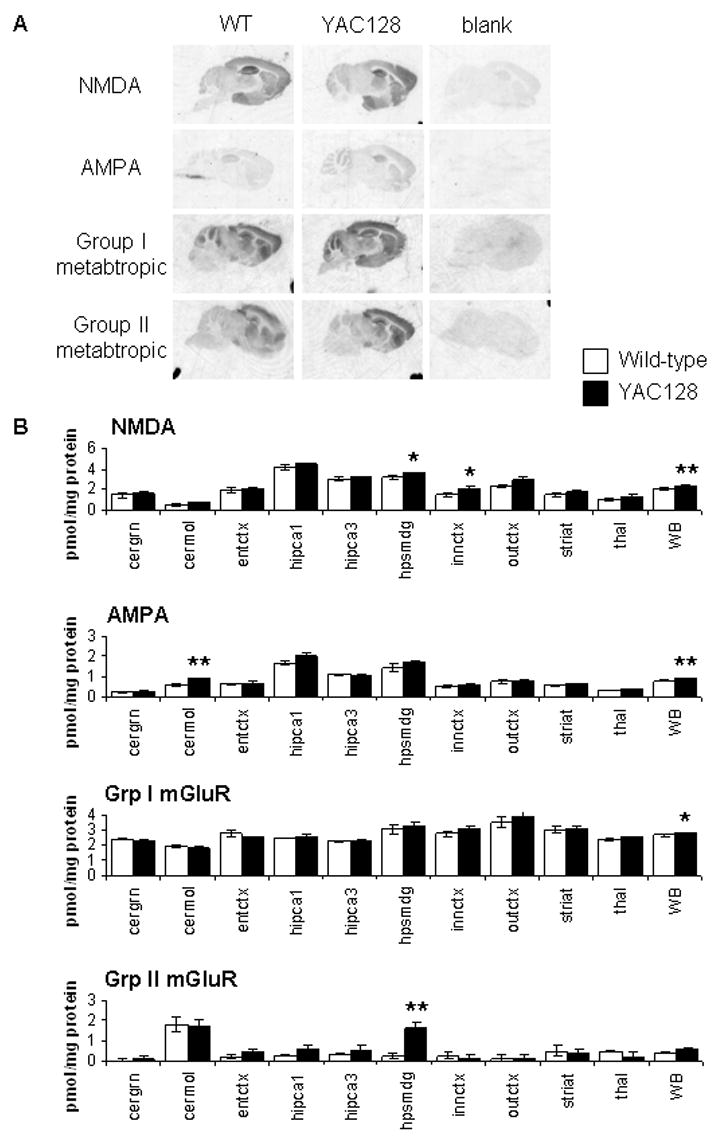
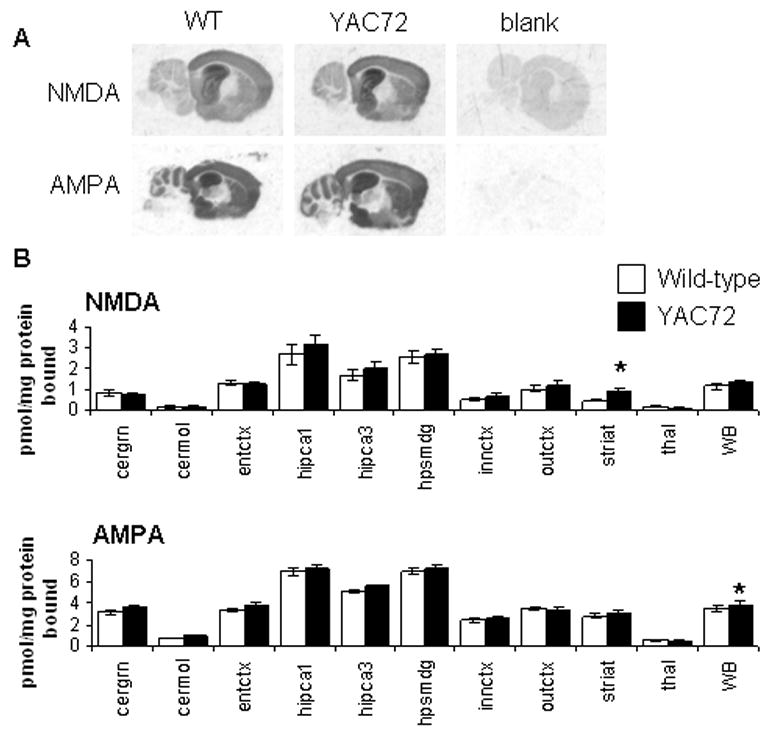
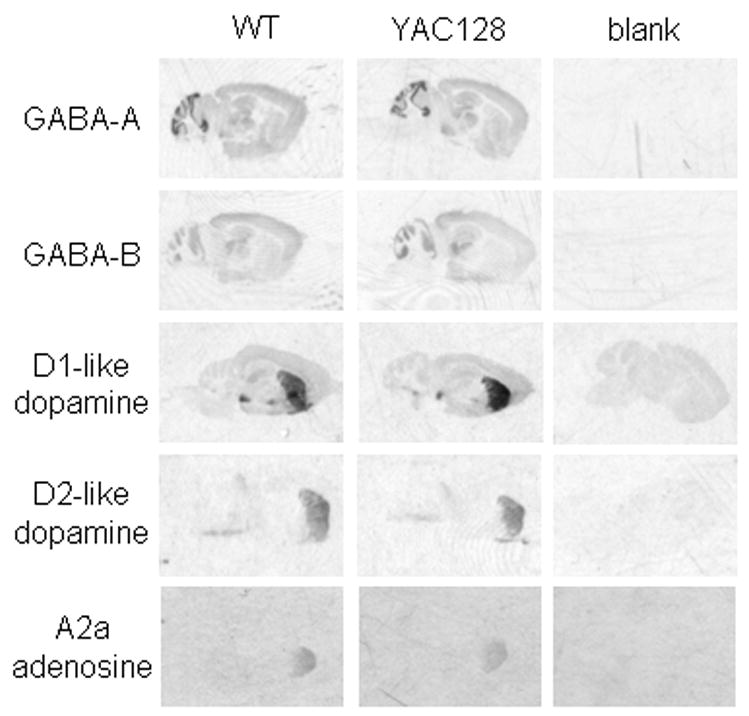
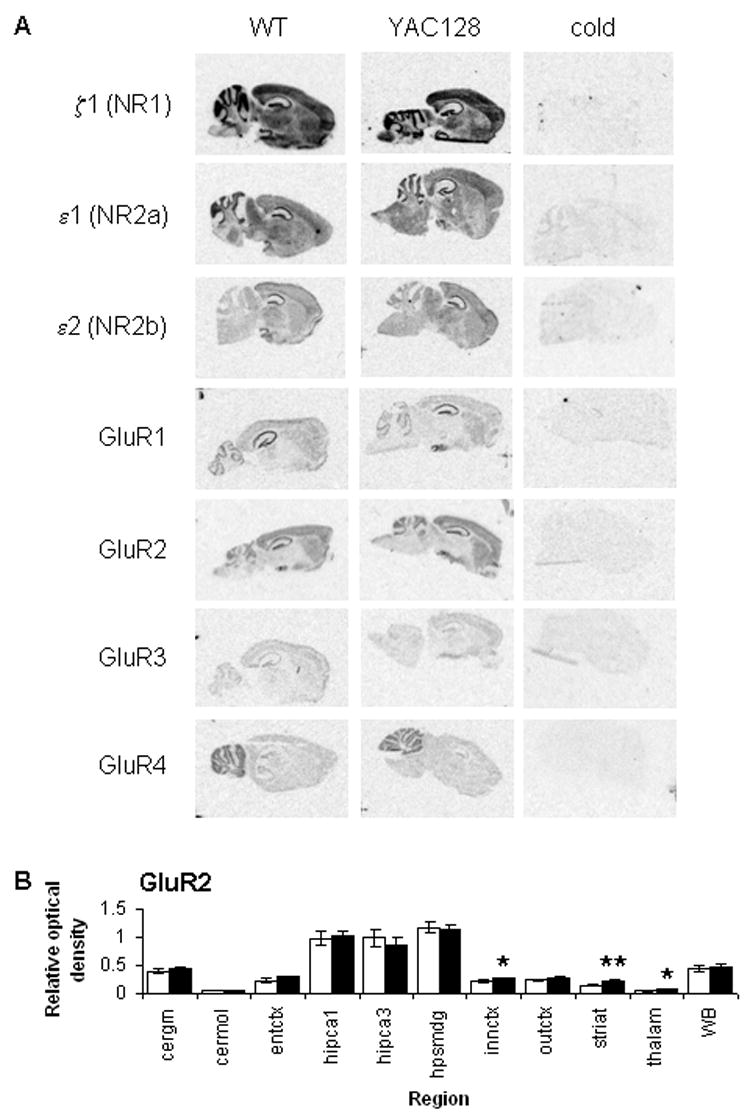
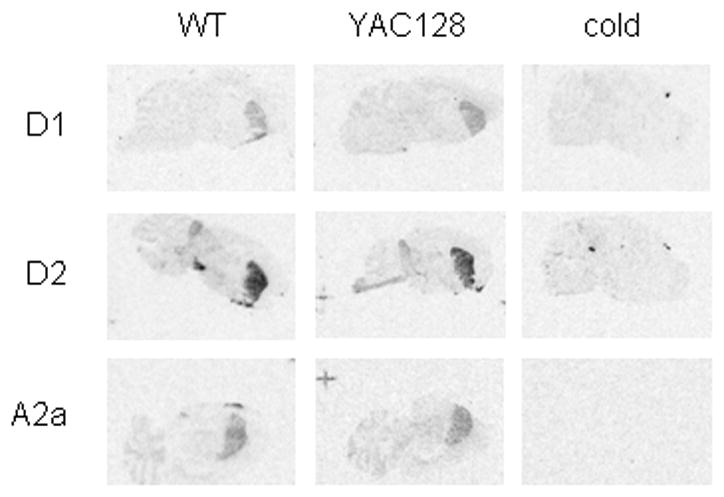
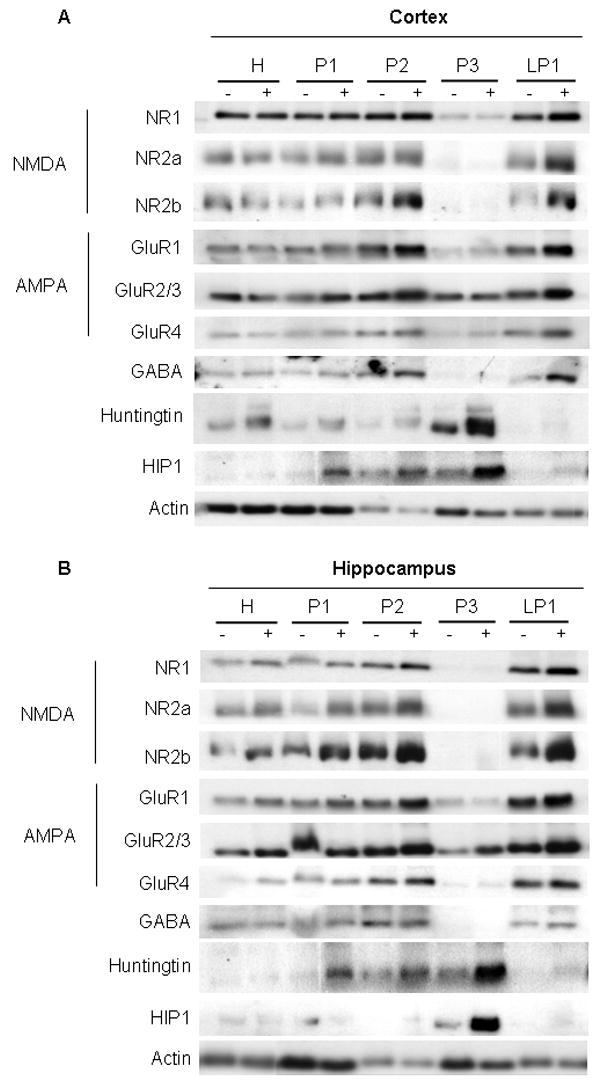
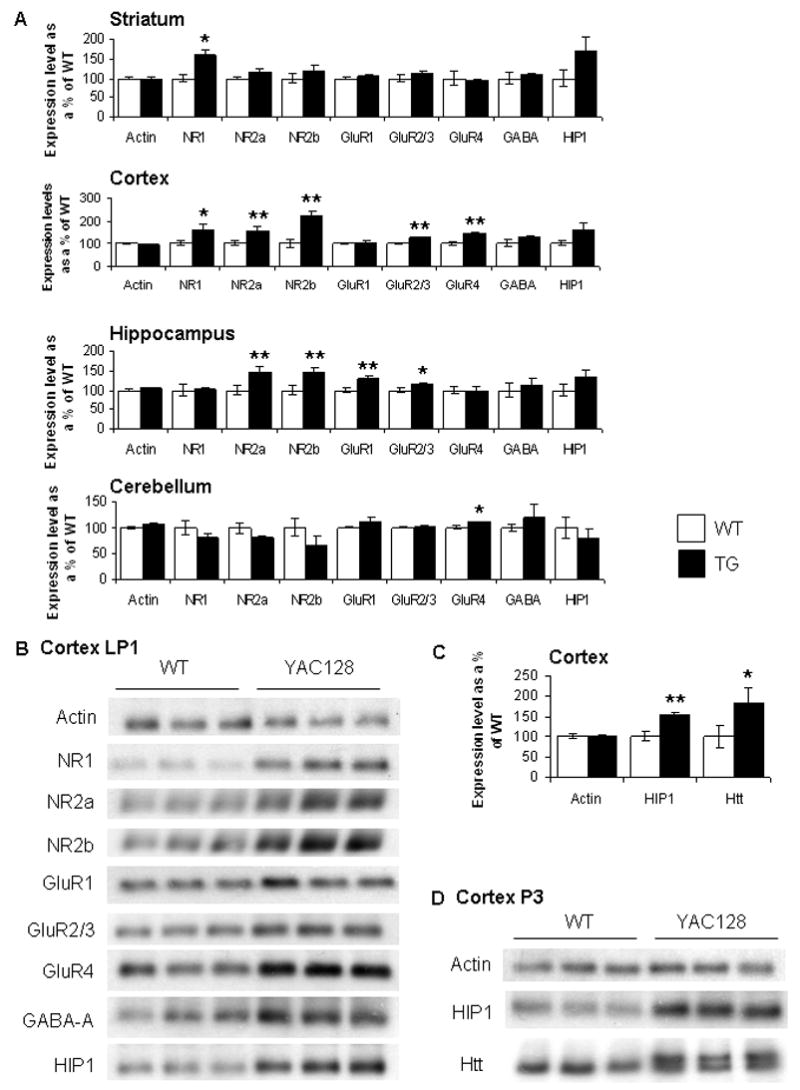
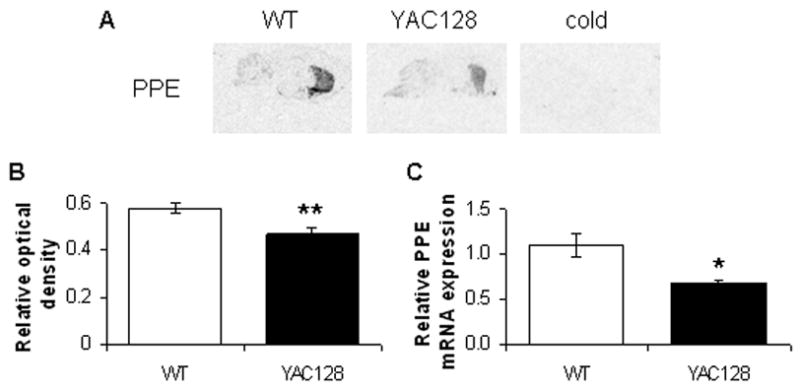
A yeast artificial chromosome (YAC) mouse model of Huntington's disease (YAC128) develops motor abnormalities, age-dependent striatal atrophy and neuronal loss. Alteration of neurotransmitter receptors, particularly glutamate and dopamine receptors, is a pathological hallmark of Huntington's disease. We therefore analyzed neurotransmitter receptors in symptomatic YAC128 Huntington's disease mice. We found significant increases in N-methyl-d-aspartate, AMPA and metabotropic glutamate receptor binding, which were not due to increases in receptor subunit mRNA expression levels. Subcellular fractionation analysis revealed increased levels of glutamate receptor subunits in synaptic membrane fractions from YAC128 mice. We found no changes in dopamine, GABA or adenosine receptor binding, nor did we see alterations in dopamine D1, D2 or adenosine A2a receptor mRNA levels. The receptor abnormalities in YAC128 transgenic mice thus appear limited to glutamate receptors. We also found a significant decrease in preproenkephalin mRNA in the striatum of YAC128 mice, which contrasts with the lack of change in levels of mRNA encoding neurotransmitter receptors. Taken together, the abnormal and selective increases in glutamate receptor subunit expression and binding are not due to increases in receptor subunit expression and may exert detrimental effects. The decrease in preproenkephalin mRNA suggests a selective transcriptional deficit, as opposed to neuronal loss, and could additionally contribute to the abnormal motor symptoms in YAC128 mice.


Conflict of interest statement

Conflict of interest statement: The authors declare that they have no competing interests.

Figures

Figure 1
Figure 1. Increased glutamate receptor binding in YAC128 mice
(a) Glutamate receptor binding appears dark in representative images of control (WT) and transgenic (YAC128) mice for NMDA, AMPA, group I and group II metabotropic glutamate receptors and blank sections demonstrate the specificity of the binding. (b) Graphs show the densitometric analysis of film images converted into to picomoles of [3H]ligand bound per milligram protein (pmol/mg protein). Regions analyzed were the granule cell layer of the cerebellum (cergrn), molecular layer of the cerebellum (cermol), entorhinal cortex (entctx), hippocampal CA1 (hipca1), CA3 (hipca3) and dentate gyrus (hpsmdg), deep layers of the frontal cortex (innctx), superficial layers of the frontal cortex (outctx), striatum (striat), thalamus (thal) and whole brain (WB). * p<0.05, ** p<0.01.
Figure 2
Figure 2. Increased glutamate receptor binding in YAC72 mice
(a) Representative images of glutamate receptor are shown for control (WT) and transgenic (YAC72) mice for NMDA and AMPA receptors. (b) Graphs show the densitometric analysis of film images converted into to picomoles of [3H]ligand bound per milligram protein (pmol/mg protein). The same regions are analyzed as for the YAC128 mice (Figure 1b). Open bars represent control mice, filled bars represent transgenic mice. * p<0.05, ** p<0.01.
Figure 3
Figure 3. Non-glutamate receptor binding is unchanged in YAC128 mice
(a) Receptor binding appears dark in representative images of control (WT) and transgenic (YAC128) mice for GABA-A, GABA-B, D1-like dopamine, D2-like dopamine, and A2a adenosine receptors and blank sections demonstrate the specificity of the binding.
Figure 4
Figure 4. Glutamate receptor subunit mRNA expression levels do not explain the increase in glutamate receptor binding in YAC128 mice
(a) Receptor subunit mRNA expression appears dark in representative images of control (WT) and transgenic (YAC128) mice for the NR1, NR2a, NR2b subunits of the NMDA receptor and the GluR1, GluR2, GluR3 and GluR4 subunits of the AMPA receptor, with “cold” sections showing the specificity of the labeling. (b) Densitometric quantitation of the GluR2 subunit mRNA levels is shown. Regions analyzed were the granule cell layer of the cerebellum (cergrn), molecular layer of the cerebellum (cermol), entorhinal cortex (entctx), hippocampal CA1 (hipca1), CA3 (hipca3) and dentate gyrus (hpsmdg), deep layers of the frontal cortex (innctx), superficial layers of the frontal cortex (outctx), striatum (striat), thalamus (thal) and whole brain (WB). Open bars represent control mice, filled bars represent transgenic mice. * p<0.05, ** p<0.01.
Figure 5
Figure 5. No change in non-glutamatergic receptor subunit mRNA expression levels in YAC128 mice
(a) Representative images of control (WT) and transgenic (YAC128) mice, with “cold” sections showing the specificity of the labeling are shown for D1 dopamine receptor, D2 dopamine receptor and A2a adenosine receptor mRNA species. Densitometric analysis revealed no differences in striatal mRNA levels for dopamine D1-or D2-like dopamine receptors, or A2a adenosine receptors (Table 2).
Figure 6
Figure 6. Subcellular fractionation analysis suggests an increase in glutamate receptor subunits in the synaptic membrane of YAC128 transgenic mice
Membrane bound subcellular fractions (20 μg) from WT (−) and YAC128 transgenic (+) dissected brain regions (striatum, cortex, hippocampus and cerebellum) were used for Western blotting. Shown are representative blots from (a) the cortex and (b) the hippocampus–regions which have the most alterations in glutamate receptor binding. Antibodies used recognize the NMDA receptor subunits NR1, NR2a, NR2b; the AMPA receptor subunits GluR1, GluR2/3, GluR4; GABA(A)a1 subunit of the GABA receptor, Htt Interacting Protein 1 (HIP1), Htt (MAb2166), with actin and Coomassie-blue stained gels (not shown) as loading controls. Key: H (total homogenate), P1 (nucleus and debris), P2 (crude synaptosomal membrane), P3 (light membrane) and LP1 (synaptosomal membrane).
Figure 7
Figure 7. Quantitation of LP1 and P3 subcellular fractions shows an increase in glutamate receptor subunits in the synaptic membrane of YAC128 transgenic mice
Membrane bound subcellular fractions (20 μg) from WT (−) and YAC128 transgenic (+) dissected brain regions (striatum, cortex, hippocampus and cerebellum) were used for Western blotting. Antibodies used recognize the NMDA receptor subunits NR1, NR2a, NR2b; the AMPA receptor subunits GluR1, GluR2/3, GluR4; GABA(A)a1 subunit of the GABA receptor, Htt Interacting Protein 1 (HIP1), Htt (MAb2166), with actin and Coomassie-blue stained gels (not shown) as loading controls. (a) Densitometry was performed on LP1 samples loaded in triplicate for the striatum, cortex, hippocampus and the cerebellum. Graphs show the amounts of each protein from the fractions which are expressed as a percentage of wild-type (WT) mice of the same brain region. Open bars represent control wild-type mice, filled bars represent transgenic YAC128 mice. * P<0.05, ** P<0.01, *** P<0.001. (b) Representative blots used for densitometry for the LP1 (synaptosomal membrane) fraction from cortex – the region which has the most alterations in glutamate receptor binding – are shown. Fractions were made from dissected regions from wild-type (WT) and transgenic (YAC128) brains. Samples are loaded in triplicate. (c) Densitometry was performed on P3 samples loaded in triplicate for the striatum, cortex, hippocampus and the cerebellum. Shown is the data from the cortex, a region which shows dramatic changes in the amounts of each protein from the transgenic fractions which are expressed as a percentage of wild-type (WT) mice of the same brain region. Open bars represent control mice, filled bars represent transgenic mice (YAC128). * P<0.05, ** P<0.01. (d) Representative blots used for densitometry of actin, HIP1 and Htt (MAb2166) in the P3 fraction from the cortex, the region which shows the most changes.
Figure 8
Figure 8. Preproenkephalin mRNA levels are decreased in YAC128 mice
(a) Preproenkephalin (PPE) mRNA levels appear dark in representative autoradiographs from control (WT) and transgenic (YAC128) mice. The decrease in intensity of signal is clearly visible in the YAC128 mouse brain section. (b) Densitometric analysis was performed on the striatum only as shown in the graph. (c) The graph shows relative PPE mRNA expression levels by real-time RT-PCR, using beta-actin mRNA levels to control for template loading. Open bars represent control mice, filled bars represent transgenic mice. * p<0.05, ** p<0.01.

References

    1. Albin RL, Greenamyre JT. Alternative excitotoxic hypotheses. Neurology. 1992;42:733–738. - PubMed
    1. Ariano MA, Aronin N, Difiglia M, Tagle DA, Sibley DR, Leavitt BR, Hayden MR, Levine MS. Striatal neurochemical changes in transgenic models of Huntington’s disease. J Neurosci Res. 2002;68:716–729. - PubMed
    1. Augood SJ, Faull RL, Love DR, Emson PC. Reduction in enkephalin and substance P messenger RNA in the striatum of early grade Huntington’s disease: a detailed cellular in situ hybridization study. Neuroscience. 1996;72:1023–1036. - PubMed
    1. Beal MF, Kowall NW, Ellison DW, Mazurek MF, Swartz KJ, Martin JB. Replication of the neurochemical characteristics of Huntington’s disease by quinolinic acid. Nature. 1986;321:168–171. - PubMed
    1. Benn CL, Farrell LA, Cha JH. Neurotransmitter receptor analysis in transgenic mouse models. Methods Mol Biol. 2004;277:231–260. - PubMed

Publication types

MeSH terms