Interaction of the C-terminal region of the Ggamma protein with model membranes
- PMID: 17545235
- PMCID: PMC1965437
- DOI: 10.1529/biophysj.106.101196
Interaction of the C-terminal region of the Ggamma protein with model membranes
Abstract
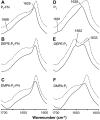
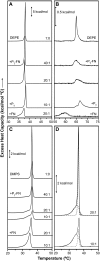
Heterotrimeric G-proteins interact with membranes. They accumulate around membrane receptors and propagate messages to effectors localized in different cellular compartments. G-protein-lipid interactions regulate G-protein cellular localization and activity. Although we recently found that the Gbetagamma dimer drives the interaction of G-proteins with nonlamellar-prone membranes, little is known about the molecular basis of this interaction. Here, we investigated the interaction of the C-terminus of the Ggamma(2) protein (P(gamma)-FN) with model membranes and those of its peptide (P(gamma)) and farnesyl (FN) moieties alone. X-ray diffraction and differential scanning calorimetry demonstrated that P(gamma)-FN, segregated into P(gamma)-FN-poor and -rich domains in phosphatidylethanolamine (PE) and phosphatidylserine (PS) membranes. In PE membranes, FN increased the nonlamellar phase propensity. Fourier transform infrared spectroscopy experiments showed that P(gamma) and P(gamma)-FN interact with the polar and interfacial regions of PE and PS bilayers. The binding of P(gamma)-FN to model membranes is due to the FN group and positively charged amino acids near this lipid. On the other hand, membrane lipids partially altered P(gamma)-FN structure, in turn increasing the fluidity of PS membranes. These data highlight the relevance of the interaction of the C-terminal region of the Ggamma protein with the cell membrane and its effect on membrane structure.
Figures


Similar articles
-
The Gbetagamma dimer drives the interaction of heterotrimeric Gi proteins with nonlamellar membrane structures.J Biol Chem. 2004 Aug 27;279(35):36540-5. doi: 10.1074/jbc.M402061200. Epub 2004 Jul 1. J Biol Chem. 2004. PMID: 15231827
-
Interaction of transmembrane-spanning segments of the alpha2-adrenergic receptor with model membranes.Mol Membr Biol. 2009 Aug;26(5):265-78. doi: 10.1080/09687680903081610. Epub 2009 Jun 30. Mol Membr Biol. 2009. PMID: 19568979
-
Caveolin scaffolding region and cholesterol-rich domains in membranes.J Mol Biol. 2005 Jan 14;345(2):339-50. doi: 10.1016/j.jmb.2004.10.064. J Mol Biol. 2005. PMID: 15571726
-
Lipid domains in bacterial membranes.Mol Microbiol. 2006 Sep;61(5):1110-7. doi: 10.1111/j.1365-2958.2006.05317.x. Mol Microbiol. 2006. PMID: 16925550 Review.
-
Peptide-lipid interactions: insights and perspectives.Org Biomol Chem. 2005 Jan 21;3(2):201-12. doi: 10.1039/b415499a. Epub 2004 Nov 26. Org Biomol Chem. 2005. PMID: 15632958 Review.
Cited by
-
Distinct behaviour of the homeodomain derived cell penetrating peptide penetratin in interaction with different phospholipids.PLoS One. 2010 Dec 30;5(12):e15819. doi: 10.1371/journal.pone.0015819. PLoS One. 2010. PMID: 21209890 Free PMC article.
-
The Implications for Cells of the Lipid Switches Driven by Protein-Membrane Interactions and the Development of Membrane Lipid Therapy.Int J Mol Sci. 2020 Mar 27;21(7):2322. doi: 10.3390/ijms21072322. Int J Mol Sci. 2020. PMID: 32230887 Free PMC article. Review.
-
Skin permeation and thermodynamic features of curcumin-loaded liposomes.J Mater Sci Mater Med. 2020 Jan 21;31(2):18. doi: 10.1007/s10856-019-6351-6. J Mater Sci Mater Med. 2020. PMID: 31965329
-
Membranes: a meeting point for lipids, proteins and therapies.J Cell Mol Med. 2008 Jun;12(3):829-75. doi: 10.1111/j.1582-4934.2008.00281.x. Epub 2008 Feb 8. J Cell Mol Med. 2008. PMID: 18266954 Free PMC article. Review.
-
Lipids in Pathophysiology and Development of the Membrane Lipid Therapy: New Bioactive Lipids.Membranes (Basel). 2021 Nov 24;11(12):919. doi: 10.3390/membranes11120919. Membranes (Basel). 2021. PMID: 34940418 Free PMC article. Review.
References
-
- Casey, P. J. 1995. Protein lipidation in cell signaling. Science. 268:221–225. - PubMed
-
- Sinensky, M. 2000. Functional aspects of polyisoprenoid protein substituents: roles in protein-protein interaction and trafficking. Biochim. Biophys. Acta. 1529:203–209. - PubMed
-
- Magee, T., and M. Hanley. 1988. Protein modification. Sticky fingers and CAAX boxes. Nature. 335:114–115. - PubMed
-
- Marshall, C. J. 1993. Protein prenylation: a mediator of protein-protein interactions. Science. 259:1865–1866. - PubMed
-
- Parish, C. A., and R. R. Rando. 1996. Isoprenylation/methylation of proteins enhances membrane association by a hydrophobic mechanism. Biochemistry. 35:8473–8477. - PubMed
Publication types
MeSH terms
Substances
LinkOut - more resources
Full Text Sources
Miscellaneous

