

doi: 10.1128/JB.00564-07.
Epub 2007 Jun 1.
The intracellular concentration of acetyl phosphate in Escherichia coli is sufficient for direct phosphorylation of two-component response regulators
Affiliations
- PMID: 17545286
- PMCID: PMC1951799
- DOI: 10.1128/JB.00564-07
Item in Clipboard
The intracellular concentration of acetyl phosphate in Escherichia coli is sufficient for direct phosphorylation of two-component response regulators
J Bacteriol.
2007 Aug.
Abstract
Acetyl phosphate, the intermediate of the AckA-Pta pathway, acts as a global signal in Escherichia coli. Although acetyl phosphate clearly signals through two-component response regulators, it remains unclear whether acetyl phosphate acts as a direct phospho donor or functions through an indirect mechanism. We used two-dimensional thin-layer chromatography to measure the relative concentrations of acetyl phosphate, acetyl coenzyme A, ATP, and GTP over the course of the entire growth curve. We estimated that the intracellular concentration of acetyl phosphate in wild-type cells reaches at least 3 mM, a concentration sufficient to activate two-component response regulators via direct phosphoryl transfer.
Figures
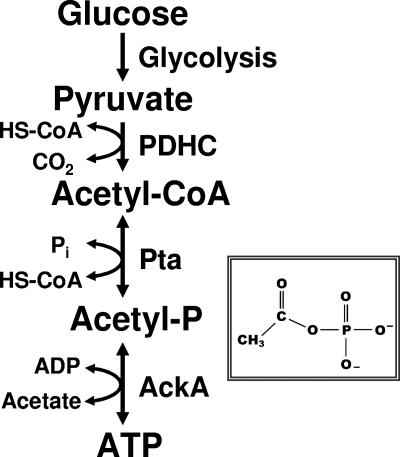
Schematic diagram of the acetate kinase (AckA)-phosphotransacetylase (Pta) pathway that interconverts acetyl-CoA and acetate. PDHC, pyruvate dehydrogenase complex. (Inset) Molecular formula of acetyl-P.
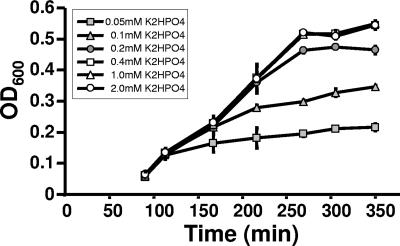
Effect of orthophosphate on growth of WT cells (strain AJW678) aerated at 37°C in MOPS medium supplemented with 0.8% pyruvate and containing K2HPO4 at the following concentrations: 2.0, 1.0, 0.4, 0.2, 0.1, and 0.05 mM. The plotted values are means of two independent experiments ± standard deviation. OD600, optical density at 600 nm.
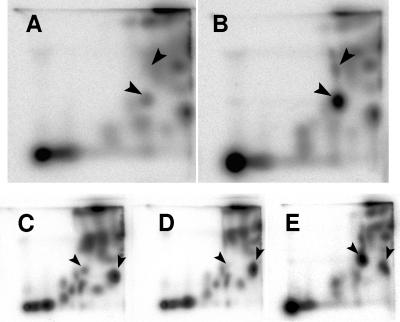
Identification of the acetyl-P signal following separation of small molecules by 2D-TLC. (A and B) Extracts of (A) WT cells (strain AJW678) and (B) WT cells spiked with synthetic [32P]acetyl-P. The arrowheads indicate orthophosphate (upper arrowhead) and acetyl-P (lower arrowhead). (C to E) Extracts of (C) WT (strain AJW678), (D) ackA pta mutant (strain AJW2013), and (E) ackA mutant (strain AJW1939). The arrowheads indicate acetyl-P (left arrowhead) and acetyl-CoA (right arrowhead).
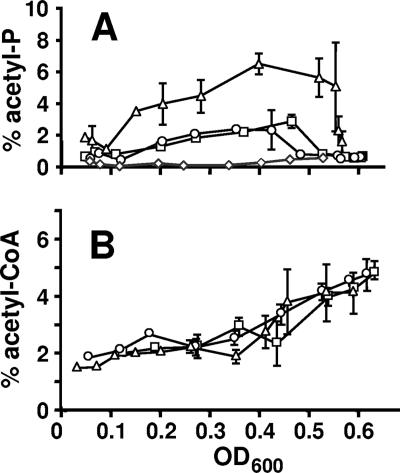
Comparison of acetyl-P and acetyl-CoA pools from cells aerated at 37°C in mMOPS supplemented with 0.8% pyruvate. Samples were harvested at regular intervals, extracts were prepared, and small molecules were separated by 2D-TLC. (A) Signal ascribed to acetyl-P plotted as a percentage of the total radioactivity applied to the plate. □, WT (strain AJW678); ○, acs mutant (strain AJW1781); ▵, ackA mutant (strain AJW1939); ⋄, ackA pta mutant (strain AJW2013). (B) Signal ascribed to acetyl-CoA plotted as a percentage of the total radioactivity applied to the plate. □, WT (strain AJW678); ○, acs mutant (strain AJW1781); ▵, ackA mutant (strain AJW1939). The plotted values are the means of two independent experiments ± standard deviation. OD600, optical density at 600 nm.
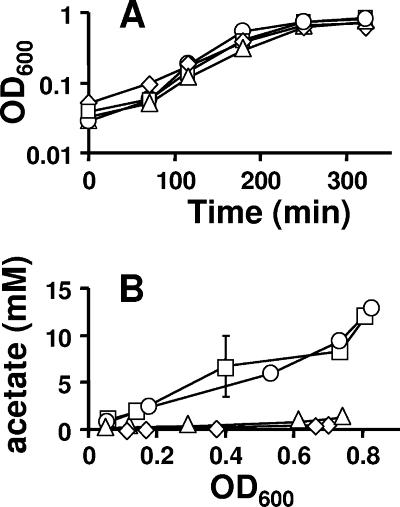
Comparison of growth (A) and extracellular acetate concentration (B) of cells aerated at 37°C in mMOPS supplemented with 0.8% pyruvate. □, WT (strain AJW678); ○, acs mutant (strain AJW1781); ▵, ackA mutant (strain AJW1939); ⋄, ackA pta mutant (strain AJW2013). The plotted values are the means of two independent experiments ± standard deviation. OD600, optical density at 600 nm.

Comparison of ATP (▵), acetyl-P (□), acetyl-CoA (○), and GTP (⋄) from WT cells (strain AJW678) aerated at 37°C in mMOPS supplemented with 0.8% pyruvate. Samples were harvested at regular intervals, extracts were prepared, and small molecules were separated by 2D-TLC. Signals ascribed to small molecules were plotted as percentages of the total radioactivity applied to the plate. The plotted values are the means of two independent experiments ± standard deviation. OD600, optical density at 600 nm; phos'd cmpd, phosphorylated compound.
References
-
- Bang, I. S., J. P. Audia, Y. K. Park, and J. W. Foster. 2002. Autoinduction of the ompR response regulator by acid shock and control of the Salmonella enterica acid tolerance response. Mol. Microbiol. 44:1235-1250. - PubMed
-
- Bertagnolli, B. L., and L. P. Hager. 1991. Activation of Escherichia coli pyruvate oxidase enhances the oxidation of hydroxyethylthiamin pyrophosphate. J. Biol. Chem. 266:10168-10173. - PubMed
-
- Bertagnolli, B. L., and L. P. Hager. 1993. Role of flavin in acetoin production by two bacterial pyruvate oxidases. Arch. Biochem. Biophys. 300:364-371. - PubMed
-
- Bochner, B. R., and B. N. Ames. 1982. Complete analysis of cellular nucleotides by two-dimensional thin layer chromatography. J. Biol. Chem. 257:9759-9769. - PubMed
-
- Bochner, B. R., and B. N. Ames. 1982. Selective precipitation orthophosphate from mixtures containing labile phosphorylated metabolites. Anal. Biochem. 122:100-107. - PubMed
Publication types
MeSH terms
Substances
Grants and funding
LinkOut - more resources
Full Text Sources
Molecular Biology Databases
