. 2007 Aug;189(15):5762-72.
doi: 10.1128/JB.00371-07. Epub 2007 Jun 1.

Deletion of the parA (soj) homologue in Pseudomonas aeruginosa causes ParB instability and affects growth rate, chromosome segregation, and motility

Affiliations

Deletion of the parA (soj) homologue in Pseudomonas aeruginosa causes ParB instability and affects growth rate, chromosome segregation, and motility

Krzysztof Lasocki et al. J Bacteriol. 2007 Aug.

Abstract

The parA and parB genes of Pseudomonas aeruginosa are located approximately 8 kb anticlockwise from oriC. ParA is a cytosolic protein present at a level of around 600 molecules per cell in exponential phase, but the level drops about fivefold in stationary phase. Overproduction of full-length ParA or the N-terminal 85 amino acids severely inhibits growth of P. aeruginosa and P. putida. Both inactivation of parA and overexpression of parA in trans in P. aeruginosa also lead to accumulation of anucleate cells and changes in motility. Inactivation of parA also increases the turnover rate (degradation) of ParB. This may provide a mechanism for controlling the level of ParB in response to the growth rate and expression of the parAB operon.


Figures

FIG. 1.
FIG. 1.
Organization of the oriC region of the P. aeruginosa genome. The gene designations used and the coordinates for open reading frames (box arrows with gene names) in the gid-par operon are those used for the P. aeruginosa PAO1 genome sequence (accession no. NC_002516). The positions of primers used for PCR are indicated by solid arrows.
FIG. 2.
FIG. 2.
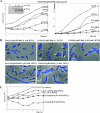
ParA intracellular level in P. aeruginosa and location of ParA in the soluble or insoluble fraction. (A) Extracts from logarithmic-phase cultures of P. aeruginosa, E. coli, and their plasmid transformants with tacp-parA (induced with 0.5 mM IPTG). Lane 1, DH5α(pKLB1 tacp-parA) (108 cells); lane 2, DH5α(pKLB40.1 tacp-parA) (108 cells); lane 3, PAO1161(pKLB40.1 tacp-parA) (108 cells); lane 4, PAO1161 (109 cells); lane 5, DH5α (1010 cells) (negative control). pKLB1 is a high-copy-number plasmid, whereas pKLB40.1 is a medium-copy-number plasmid. (B) Intracellular level of ParA. Overnight cultures of PAO1161 were diluted 103-fold and grown at 37°C with shaking. Samples from five cultures, designated cultures 1 to 5, were collected at hourly intervals, diluted, plated to estimate the number of CFU ml−1, and frozen. Extracts of 5 × 10⁹ viable cells from culture 1 (lanes 1) and of 2 × 10⁹ cells from cultures 2 to 5 (lanes 2 to 5) were prepared, separated by SDS-PAGE, and analyzed by Western blotting with anti-ParA antibodies. The amount of ParA was estimated by comparison with diluted samples of purified His6-ParA whose concentrations were known run on the same gel. (C) Distribution of ParA. The cells from a logarithmically growing culture (OD600, ∼0.6) were sonicated in 50 mM Na phosphate buffer (pH 8.0) in the presence of different NaCl concentrations and then separated into cell debris and supernatant by centrifugation at 15,000 rpm for 30 min. The pellet was resuspended in a volume of sonication buffer equivalent to the volume of the removed soluble fraction. The total sonicate (lane T), soluble extract (lane S), and cell debris (lane D) corresponding to 2 × 10⁹ cells were subjected to SDS-PAGE and analyzed by Western blotting.
FIG. 3.
FIG. 3.
Effects of ParA overproduction in different species. (A) Growth of P. aeruginosa in the presence of elevated ParA levels. An overnight culture of PAO1161(pKLB40.1) was diluted into fresh medium with an antibiotic and different concentrations of IPTG and grown at 37°C. PAO1161(pGBT400) grown in the presence of 1 mM IPTG was used as the control. Growth was monitored by determining the OD600, and at hourly intervals samples of the cultures were diluted and plated to estimate the number of CFU ml−1. The inset shows the results for a Western blot of 109 cells of PAO1161(pGBT400) grown in the presence of 1 mM IPTG (track C) and PAO1161(pKLB40.1) grown in the absence of IPTG and in the presence of different IPTG concentrations. The ParA degradation products are visible (brace). (B) Micrographs of P. aeruginosa cells. After 5 to 6 h of growth with different concentrations of IPTG samples of PAO1161(pKLB40.1) were DAPI stained and photographed. The images correspond to overlays of phase-contrast and fluorescence micrographs. The arrows indicate anucleate cells. (C) Growth of E. coli and P. putida. Overnight cultures of pKLB40.1 transformants of E. coli DH5α, P. putida KT2442, and P. aeruginosa PAO1161 (for comparison) were diluted 103-fold and grown with different IPTG concentrations. At hourly intervals the cultures were diluted and plated to estimate the number of CFU ml−1. The control data are data for E. coli DH5α(pGBT400) grown with 0.5 mM IPTG. For clarity only results for cultures grown with 0.5 mM IPTG are shown, and DH5α(pKLB40.1) was grown without IPTG as this strain appeared to grow more slowly than it did after parA induction by IPTG.
FIG. 4.
FIG. 4.
Mapping of the part of ParA causing the growth inhibition of P. aeruginosa when it is overproduced. The diagram on the left shows the parA alleles cloned under tacp in pGBT400 derivatives. The highly conserved Walker-type ATPase motifs in parA are indicated. The deletions of parA were constructed by modification of the restriction sites or by use of PCR (parA14-262). On the right growth curves for PAO1161 transformants overproducing ParA derivatives are shown. PAO1161(pGBT400) was used as the control strain (vector). Symbols: ⋄, PAO1161(pKLB40.3); □, PAO1161(pKLB40.5); ▴, PAO1161(pKLB40.1); ▵, PAO1161(pKLB40.8); ▪, PAO1161(pKLB40.15); ○, PAO1161(pJMB508).
FIG. 5.
FIG. 5.
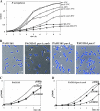
Growth defects of the parA mutants. (A) Growth curves of PAO1161 (wt), PAO1161parA::smh (parA::smh), and PAO1161parA+ revertant (parA+) grown at different temperatures on rich medium (L broth) (open and shaded symbols) and minimal medium (M9) (solid symbols). (B) Micrographs of P. aeruginosa cells taken from logarithmically growing cultures in L broth at 37°C. The images correspond to overlays of phase-contrast and fluorescence (DAPI-stained) photographs. The arrows indicate anucleate cells. (C) Growth curves of PAO1161(pBBR1-MCS1), PAO1161(pJMB503 tacp-parA), and PAO1161(pABB33 tacp-parA parB) grown on rich medium at 37°C without IPTG. (D) Growth curves of PAO1161parA::smh(pBBR1-MCS1), PAO1161parA::smh(pJMB503 tacp-parA), and PAO1161parA::smh(pABB33 tacp-parA parB) grown on rich medium at 37°C without IPTG.
FIG. 6.
FIG. 6.
Colony formation and motilities of PAO1161 derivatives. (A) Colony morphology of PAO1161, PAO1161parA::smh, PAO1161parAstop, and PAO1161(pJMB503 tacp-parA). (B) Motility of PAO1161 and its derivatives tested on special media. The tests were performed with PAO1161 (wt), the PAO1161parA::smh mutant (parA::smh), two revertants of the PAO1161parA::smh mutant (rev1 and rev2), PAO1161parAstop (parAstop), and transformants of PAO1161(pBBR1-MCS1) (wt/v), PAO1161(pJMB503) (wt/parA), PAO1161(pABB33) (wt/parAB), PAO1161parA::smh(pBBR1-MCS1) (parA::smh/v), and PAO1161parA::smh(pJMB503) (parA::smh/parA). The inset for the swarming test shows the results after 24 h; one of the plates is also shown after 48 h.
FIG. 7.
FIG. 7.
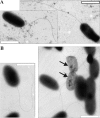
Electron microscopy of Pseudomonas cells (courtesy of L. Dziewit). (A) Photographs of PAO1161Rifr cells taken from L-agar plates. (B) PAO1161parA::smh cells. The “ghost” cells (indicated by arrows) appeared with a frequency up to 10%. Magnifications, ×8,000 for PAO1161 and ×16,000 for PAO1161parA::smh. Bars = 1,000 nm.
FIG. 8.
FIG. 8.
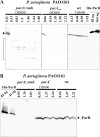
ParB depletion in the parA mutants. (A) Western blot of samples from PAO1161parA::smh, PAO1161parAstop, and PAO1161 cultures with anti-ParB antibodies. The cultures were diluted 50-fold into fresh medium, samples were collected at different OD600 values, and the extracts from 109 cells were loaded on the gel. The brackets indicate the positions of the ParB degradation products. Purified His6-ParB was run as the control. (B) Western blot of extracts from PAO1161, PAO1161parA::smh, and PAO1661parA+ “revertant” cultures with anti-ParB antibodies. The samples were collected at different OD600 values, and the extracts were loaded on the gel (normalized to 109 cells). Purified His6-ParB was run as a control.

Similar articles

Cited by

References

    1. Adachi, S., K. Hori, and S. Hiraga. 2006. Subcellular positioning of F plasmid mediated by dynamic localization of SopA and SopB. J. Mol. Biol. 356:850-863. - PubMed
    1. Autret, S., and J. Errington. 2003. A role for division-site-selection protein MinD in regulation of internucleoid jumping of Soj (ParA) protein in Bacillus subtilis. Mol. Microbiol. 47:159-169. - PubMed
    1. Barilla, D., M. F. Rosenberg, U. Nobbmannn, and F. Hayes. 2005. Bacterial DNA segregation dynamics mediated by the polymerizing protein ParF. EMBO J. 24:1453-1464. - PMC - PubMed
    1. Bartosik, A. A., and G. Jagura-Burdzy. 2005. Bacterial chromosome segregation. Acta Biochim. Pol. 52:1-34. - PubMed
    1. Bartosik, A. A., K. Lasocki, J. Mierzejewska, C. M. Thomas, and G. Jagura-Burdzy. 2004. ParB of Pseudomonas aeruginosa: interactions with its partner ParA and its target parS and specific effects on bacterial growth. J. Bacteriol. 186:6983-6998. - PMC - PubMed

Publication types

MeSH terms

Substances

LinkOut - more resources