. 2007 Jun 12;104(24):10258-63.
doi: 10.1073/pnas.0703813104. Epub 2007 Jun 1.

Dopaminergic modulation of short-term synaptic plasticity at striatal inhibitory synapses

Affiliations

Dopaminergic modulation of short-term synaptic plasticity at striatal inhibitory synapses

Fatuel Tecuapetla et al. Proc Natl Acad Sci U S A. .

Abstract

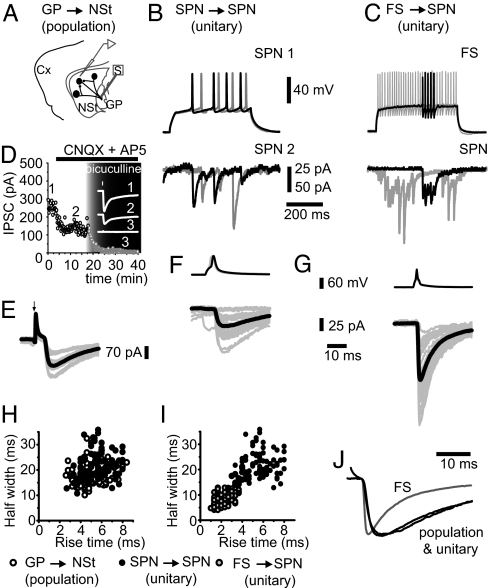
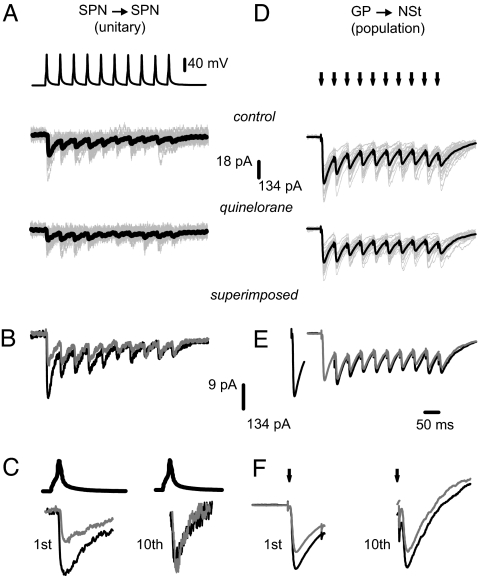
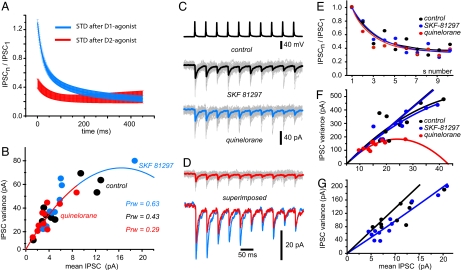
Circuit properties, such as the selection of motor synergies, have been posited as relevant tasks for the recurrent inhibitory synapses between spiny projection neurons of the neostriatum, a nucleus of the basal ganglia participating in procedural learning and voluntary motor control. Here we show how the dopaminergic system regulates short-term plasticity (STP) in these synapses. STP is thought to endow neuronal circuits with computational powers such as gain control, filtering, and the emergence of transitory net states. But little is known about STP regulation. Employing unitary and population synaptic recordings, we observed that activation of dopamine receptors can modulate STP between spiny neurons. A D(1)-class agonist enhances, whereas a D(2)-class agonist decreases, short-term depression most probably by synaptic redistribution. Presynaptic receptors appear to be responsible for this modulation. In contrast, STP between fast-spiking interneurons and spiny projection neurons is largely unregulated despite expressing presynaptic receptors. Thus, the present experiments provide an explanation for dopamine actions at the circuit level: the control of STP between lateral connections of output neurons and the reorganization of the balance between different forms of inhibitory transmission. Theoretically, D(1) receptors would promote a sensitive, responsive state for temporal precision (dynamic component), whereas D(2) receptors would sense background activity (static component).


Conflict of interest statement

The authors declare no conflict of interest.

Figures

Fig. 1.
Fig. 1.
Inhibition in the NSt. (A) Arrangement for recording “population” IPSCs from GP→NSt connections. A postsynaptic SPN of the NSt is being recorded. It receives multiple terminals from other SPNs. Striofugal axons from SPNs, which are presynaptic to the recorded SPN, are stimulated antidromically (S) at the GP. (B) SPN→SPN connection: Evoked action potentials (APs) in a presynaptic SPN (SPN1) generate IPSCs in a postsynaptic SPN (SPN2). (C) FS→SPN connection: Evoked APs in a presynaptic FS interneuron generate either tonic (gray) or bursting (black) discharges that evoke IPSCs in a postsynaptic SPN. (D) GP→NSt synaptic responses (1) are blocked by 10 μM CNQX and 50 μM APV, leaving an IPSC (2) that can be blocked by 10 μM bicuculline (3). (E) IPSC from the GP→NSt connection. Arrow, stimulus artifact; black trace, average of 20 of 24 individual responses (gray). (F) IPSC from the SPN→SPN connection. (G) IPSC from the FS→SPN connection. (F and G Upper) Traces of presynaptic APs. (F and G Lower) Unitary IPSCs. (H) IPSC rise times against half widths (shape index plots) obtained from GP→NSt (empty circles) and SPN→SPN (filled circles) connections (n = 9). Note that the samples are undistinguishable from each other. (I) Same plot comparing FS→SPN (gray circles) and SPN→SPN (filled circles) connections (n = 9). Note that the samples are clearly separate. (J) Averaged and normalized IPSCs from all three connections. Note virtual identical shapes for SPN→SPN (unitary) and GP→NSt (population) connections. Gray trace corresponds to the FS→SPN connection.
Fig. 2.
Fig. 2.
STD kinetics of neostriatal inhibitory synapses. From top to bottom, trains of IPSCs from each connection in response to a 20-Hz train of stimulus delivered at 0.1 Hz. (A) GP→NST. (B) SPN→SPN. (C) FS→SPN. (A–C) Black trace, average of 25 individual responses (gray). (D) STD kinetics: Normalized and averaged IPSC amplitudes evoked with stimulus trains. Lines are fits to: IPSC(t) = A1e−x/τ1 + A2e−x/τ2 + y0, where τ1 is the faster time constant of decay (see Materials and Methods). Note virtually identical STD kinetics for SPN→SPN (unitary) and GP→NSt (population) connections and a slower decay for the FS→SPN connection. (E) Direct relationships between IPSC amplitudes and CV−2 (r2 > 0.9 for all connections; P < 0.002). Note the plot superimposition for SPN→SPN (unitary) and GP→NSt (population) connections and a separate relationship for the FS→SPN connection.
Fig. 3.
Fig. 3.
D1-class receptor activation enhances STD. (A) SPN→SPN connection. Presynaptic APs (Top), evoked IPSCs (Middle; average, black; trials, gray), and responses (Bottom) to the same stimuli after addition of SKF-81297 (1 μM). (B) Superimposition of average traces in control and after the D1-agonist. (C) Amplification of the 1st and 10th responses at both conditions. (D) GP→NSt connection. From top to bottom, field stimuli at the GP (arrows) and evoked IPSCs in control and after addition of SKF-81297 (1 μM). (E) Superimposition of average traces in control and after the D1-agonist. (F) Amplification of the 1st and 10th responses at both conditions. Note similarity of action of the D1-agonist for unitary (A–C) and population (D–F) responses, the increase in the amplitude of IPSC1, and the decrease in the paired pulse ratio (IPSC2/IPSC1) between the first two responses.
Fig. 4.
Fig. 4.
D2-class receptor activation decreases STD. (A) SPN→SPN connection. Presynaptic APs (Top), evoked IPSCs (Middle; average, black; trials, gray), and responses (Bottom) to the same stimuli after addition of quinelorane (1 μM). (B) Superimposition of average traces in control and after the D2-agonist. (C) Amplification of the 1st and 10th responses at both conditions. (D) GP→NSt connection. Field stimuli at the GP (Top, arrows) and evoked IPSCs in control (Middle) and after (Bottom) addition of quinelorane (1 μM). (E) Superimposition of average traces in control and after the D2-agonist. (F) Amplification of the 1st and 10th responses at both conditions. Note similarity of action of the D2-agonist for unitary (A–C) and population (D–F) responses, the decrease in the amplitude of IPSC1, and the increase in the paired pulse ratio for the first two IPSCs.
Fig. 5.
Fig. 5.
Modulation is different for interneurons. (A) Summary plot of all responsive synapses interconnecting SPNs comparing STD kinetics after the D1-class agonist (blue) and D2-class agonist (red) (mean ± SEM). Plots show the lower and upper limits of dopamine-induced STD variation for synapses interconnecting SPNs. (B) Variance-mean analysis in one SPN→SPN connection that responded to both D1- and D2-agonists. If all points are fitted to one parabola (see SI Text), D1-action increases and D2-action decreases release probability. (C) FS→SPN connection. (Top) Presynaptic APs from an FS interneuron evoked IPSCs from a postsynaptic SPN in the control (black) after adding SKF-81297 (1 μM) (blue) (Middle) and after adding quinelorane (1 μM) (red) (Bottom). Note that SKF-81297 had no effects, but quinelorane did. (D) Last two traces (after D1- and D2-agonists) are shown expanded and superimposed. Quinelorane had a clear action: Most IPSCs were reduced. (E) However, there was no change in STD kinetics after any dopamine agonist. (F) Variance-mean analysis of the same FS→SPN connection. The change in initial plot after quinelorane was not significant. (G) In the FS→SPN connection, responsive to the D1-agonist, there was a change in initial slope after variance-mean analysis.

Similar articles

Cited by

References

    1. Zucker RS, Regehr WG. Ann Rev Physiol. 2002;64:355–405. - PubMed
    1. Abbott LF, Nelson SB. Nat Neurosci. 2000;3:1178–1183. - PubMed
    1. Thomson AM. Trends Neurosci. 2000;23:305–312. - PubMed
    1. Abbott LF, Regehr WG. Nature. 2004;431:796–803. - PubMed
    1. Thomson AM. Prog Neurobiol. 2000;62:159–196. - PubMed

Publication types

MeSH terms