. 2007 Sep;6(9):1682-92.
doi: 10.1128/EC.00208-06. Epub 2007 Jun 1.

Trichoderma atroviride PHR1, a fungal photolyase responsible for DNA repair, autoregulates its own photoinduction

Affiliations

Trichoderma atroviride PHR1, a fungal photolyase responsible for DNA repair, autoregulates its own photoinduction

Gloria M Berrocal-Tito et al. Eukaryot Cell. 2007 Sep.

Abstract

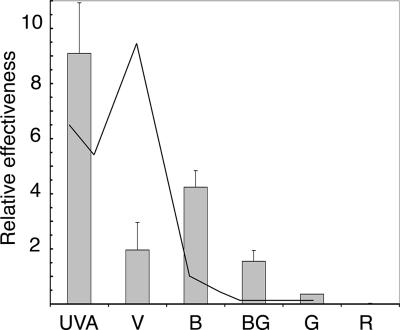
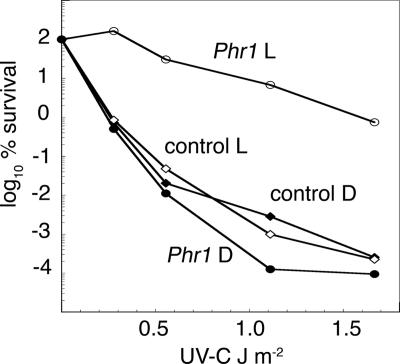
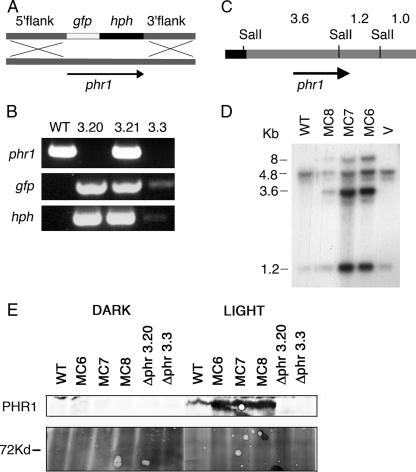
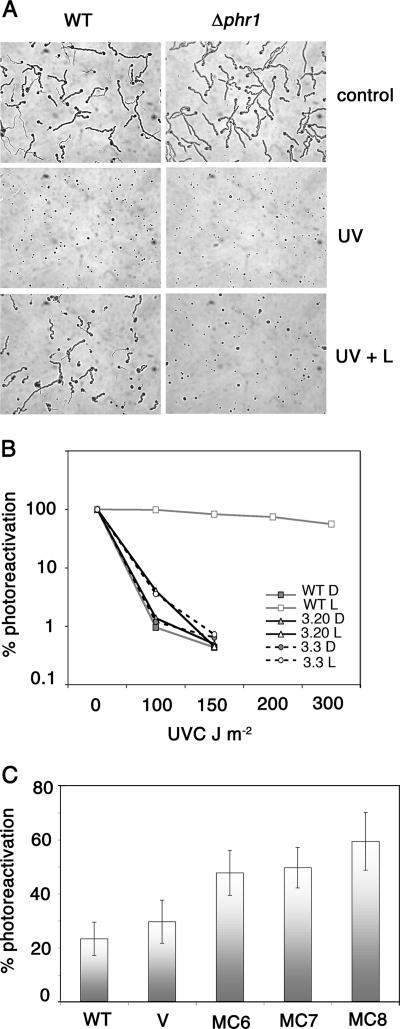
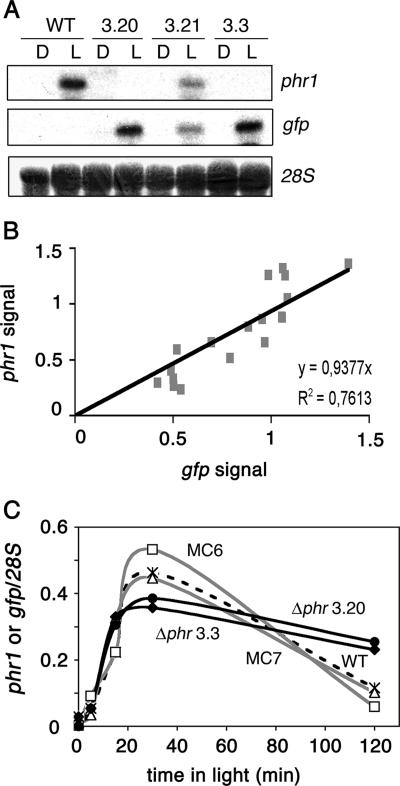
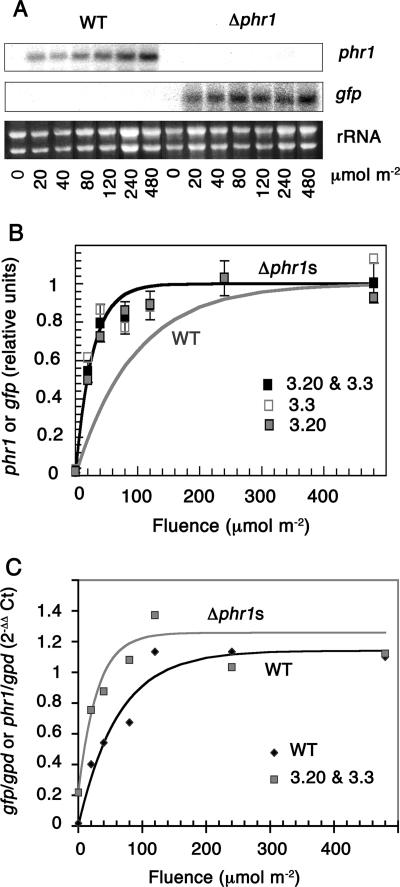
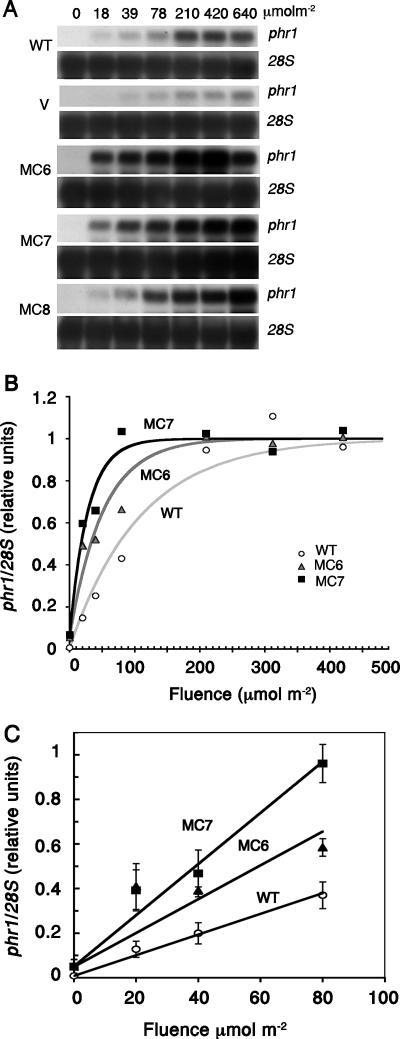
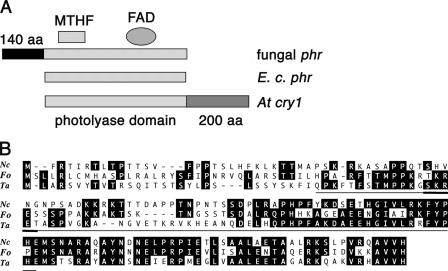
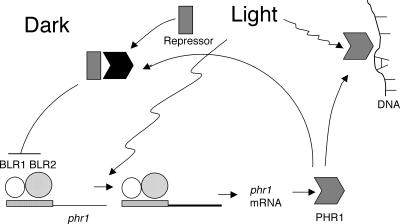
The photolyases, DNA repair enzymes that use visible and long-wavelength UV light to repair cyclobutane pyrimidine dimers (CPDs) created by short-wavelength UV, belong to the larger photolyase-cryptochrome gene family. Cryptochromes (UVA-blue light photoreceptors) lack repair activity, and sensory and regulatory roles have been defined for them in plants and animals. Evolutionary considerations indicate that cryptochromes diverged from CPD photolyases before the emergence of eukaryotes. In prokaryotes and lower eukaryotes, some photolyases might have photosensory functions. phr1 codes for a class I CPD photolyase in Trichoderma atroviride. phr1 is rapidly induced by blue and UVA light, and its photoinduction requires functional blue light regulator (BLR) proteins, which are White Collar homologs in Trichoderma. Here we show that deletion of phr1 abolished photoreactivation of UVC (200 to 280 nm)-inhibited spores and thus that PHR1 is the main component of the photorepair system. The 2-kb 5' upstream region of phr1, with putative light-regulated elements, confers blue light regulation on a reporter gene. To assess phr1 photosensory function, fluence response curves of this light-regulated promoter were tested in null mutant (Deltaphr1) strains. Photoinduction of the phr1 promoter in Deltaphr1 strains was >5-fold more sensitive to light than that in the wild type, whereas in PHR1-overexpressing lines the sensitivity to light increased about 2-fold. Our data suggest that PHR1 may regulate its expression in a light-dependent manner, perhaps through negative modulation of the BLR proteins. This is the first evidence for a regulatory role of photolyase, a role usually attributed to cryptochromes.


Figures

FIG. 1.
FIG. 1.
Wavelength dependence of phr1 induction. Northern analysis was performed from induced cultures by fluences of different spectral regions. Data from different blue filters were consistent within the variability and were combined. The peak transmission wavelengths, in nm, of the filters were as follows: UVA, 360 (300 to 390); violet, 412 (330 to 530); blue, 440 (395 to 500) and 458 (380 to 560); blue-green, 505 (450 to 560); green, 505 to 600; and red, 585 to 760 (the numbers in parentheses indicate the ranges for >10% transmission). Relative effectiveness was calculated from densitometric measurements of phr1 and normalized against the 28S rRNA signal, in the linear range (0 to 0.6 of maximum) (see Fig. 7). Bars are means with standard errors (SE) for two to six replicates. The photoreactivation action spectrum is shown schematically as a line for comparison.
FIG. 2.
FIG. 2.
Trichoderma phr1 encodes a functional photolyase. E. coli lacking CPD photolyase was complemented by phr1. Circles, E. coli SY2 carrying the phr1 coding sequence (Phr1); diamonds, E. coli SY2 carrying phr1 cloned in reverse orientation (control). Photoreactivation (L; empty symbols) was induced with white light for 30 min at 30 μmol m−2 s−1; dark (D; filled symbols) samples were incubated in total darkness following UVC exposure. Each point is the mean of two replicates.
FIG. 3.
FIG. 3.
Construction of transgenic strains. (A) Strategy for replacement of phr1. The construct contains the upstream region of the phr1 coding sequence (5′ flank) ligated to the gfp coding region, followed by the hph gene under the control of the trpC promoter and, finally, by the downstream region of phr1 (3′ flank). The arrow represents the coding region. (B) Identification of phr1-deleted strains (Δphr1) by PCR analysis of transformants. Amplification of phr1 and markers was assayed with genomic DNAs from the indicated strains. 3.20 and 3.3, Δphr1 strains; 3.21, ectopic integration strain. (C) Plasmid pT3T7phr1 5.8 map used for obtaining MC strains. Relevant restriction enzyme sites are shown. Black, plasmid region; gray, phr1 clone. (D) Identification of overexpresser strains (MC) by Southern analysis of the phr1 transformants. A blot of SalI digests of genomic DNAs from the indicated strains was probed with the 5.8-kb phr1 PstI fragment. The 4.8-kb bands correspond to the WT gene, and 3.6-kb bands correspond to the exogenous copy. The 1.2-kb fragment is present in both digests. The densitometric ratio of the 3.6-kb to 4.8-kb bands shows that strains MC6 and MC7 have two extra copies and strain MC8 has one extra copy. V contains the cotransformation vector. (E) PHR1 levels in transgenic strains were determined by Western blotting (top). Ponceau staining is shown as a loading control (bottom). Dark, samples grown in total darkness; light, samples were frozen 30 min after a saturating exposure to blue light (540 μmol m−2).
FIG. 4.
FIG. 4.
Photoreactivation of spores from transgenic lines. (A) Loss of photoreactivation in Δphr1 mutant line. One-week-old spores from the WT and a Δphr1 mutant grown in constant light at 30 μmol m−2 s−1 were either light treated or not, kept in darkness for 16 h, and examined for germination. The percentage of spore germination represents the percentage of photoreactivation. Control, no light treatment; UV, after inactivation by 100 J m−2 UVC; UV + L, exposed for 30 min to 40 to 60 μmol m−2 white light irradiation immediately after UVC treatment. (B) Photoreactivation curves from Δphr1 3.3 and 3.20 mutant lines. Spores were exposed to the indicated amounts of UVC (x axis) and then either incubated in the dark (D) or exposed to photoreactivating light treatment (L). (C) Photoreactivation of MC lines. Seven-day-old spores from either cultures grown with a 16-h photoperiod at 30 μmol m−2 s−l irradiance or dark-grown spores from MC strains (MC6, MC7, and MC8) and controls (WT and V) were assayed for photoreactivation as described previously (41), except that the photoreactivating light exposure was 15 min from a cool-white fluorescent tube at 40 to 60 μmol m−2 s−1. Bars represent means ± SE (n = 6). Values are as follows: WT, 23.41 ± 6.17; V, 29.73 ± 7.97; MC6, 47.82 ± 8.32; MC7, 49.72 ± 7.51; and MC8, 59.46 ± 10.65.
FIG. 5.
FIG. 5.
gfp under control of the phr1 promoter is photoinduced in phr1 null strains. (A) Northern analysis was performed on total RNA from dark-grown (D) or light-induced cultures (L) exposed to a fluence of 540 μmol m−2 blue light. 3.3 and 3.20, Δphr1 mutants, 3.21, ectopic line. (B) Correlation of gfp and phr1 expression in a cell line carrying both the transgene and the resident phr1 copy. Each point represents the gfp signal (x axis) and phr1 signal (y axis) of a single RNA sample. (C) Time course of photoinduction in transgenic lines. Northern analysis was performed on total RNA from dark-grown (0) or light-induced cultures exposed to a fluence of 540 μmol m−2 blue light. Samples were collected 0, 5, 15, 30, 60, and 120 min after the pulse. The phr1 signal value was normalized against the 28S signal. The curves of phr1 induction for the WT and the transgenic lines are shown. MC6 and MC7 are MC strains, and 3.3 and 3.20 are null mutants.
FIG. 6.
FIG. 6.
Light sensitivity for induction of gfp under control of the phr1 promoter in Δphr1 strains. (A) Northern blot representative of the data used to construct the graph in panel B. The fluence of the light pulse is indicated for each lane. (B) Fluence response curves. Each RNA sample was from one or two mycelial colonies; data are from phosphorimager scanning of the RNA blot hybridizations. The phr1 and gfp signal values were normalized against the rRNA signal, and the data were then normalized for overall changes in hybridization intensity between experiments by dividing them by the mean of the three highest fluence points. Black squares indicate means with SE for three independent experiments with two Δphr1 lines each (separate data for each are also indicated). The lines are nonlinear least-squares fits to an exponential model, calculated as described previously (5). Statistics for the least-squares fits are given in Table 1. The black line is the fit to the combined Δphr1 data, and the gray line is a least-squares fit to phr1 fluence response curves from three independent experiments on the WT. (C) Real-time PCR data for RNA samples from the same experiments. The y axis indicates the transcript abundance of phr1 (WT) or gfpphr1) relative to the abundance of gpdh transcript in the same samples and to the signal at the highest fluence, calculated as formula image.
FIG. 7.
FIG. 7.
Fluence response curves for the induction of phr1 in MC lines. (A) Representative set of Northern blots. (B) Fluence response curves. Circles represent the WT, and triangles and squares represent the three-copy strains MC6 and MC7, respectively. Each RNA sample was pooled from five photoinduced mycelial colonies; data are from densitometric or phosphorimager scanning of the RNA blot hybridizations from five, five, and two independent experiments for the WT, MC6, and MC7, respectively. The two scanning methods gave results that were identical within the variability. Data analysis was done as described in the legend to Fig. 6. Statistics for the least-squares fits are given in Table 1. (C) The linear range of the same data was plotted. Error bars indicate standard errors of the means for independent experiments, and the lines are linear regression plots.
FIG. 8.
FIG. 8.
blu gene photoinduction is altered in phr1-overexpressing and -deleted strains. (A) Photoinduction fluence response assays of phr1, blu6, blu8, blu16, and blu17 were carried out with the overexpresser strain MC7, the Δphr1 knockout strain 3.20, and the WT strain by Northern blot hybridization. The fluence of the light pulse is indicated for each lane. (B) Fluence response curves. Data are from densitometric scanning of the RNA blot hybridizations, normalized using gpdh transcript levels in the same blots.
FIG. 9.
FIG. 9.
Comparison of N-terminal regions of light-regulated fungal photolyases. (A) Schematic comparison of fungal photolyases and cryptochromes. (B) Alignment of the 140 N-terminal amino acids of light-regulated fungal photolyases. The underlined region of PHR1 shows homology with presenilin and amphiphysin, and the heavy line indicates a phosphorylation site. E. c., E. coli; At, A. thaliana; Nc, N. crassa; Fo, F. oxyosporum; Ta, T. atroviride.
FIG. 10.
FIG. 10.
Photolyase light-dependent autoregulation model. Circles, blue light regulators (BRL) 1 and 2; gray box and solid line, phr1 promoter and coding regions; black and gray polygons, DNA photolyase (PHR1) with different photochemical properties; rectangle, putative repressor; lightning, exogenous light. Photolyase would act as a modulator of its own transcription through interaction with the BRL complex, recruiting a repressor to the complex in the dark. Light relieves repression by an unknown mechanism, resulting in activation of phr1 transcription, which is dependent on BLR1 and BLR2. In addition, light activates PHR1 for DNA repair.

Similar articles

Cited by

References

    1. Ahmad, M., and A. R. Cashmore. 1993. HY4 gene of A. thaliana encodes a protein with characteristics of a blue-light photoreceptor. Nature 366:162-166. - PubMed
    1. Alejandre-Duran, E., T. Roldan-Arjona, R. R. Ariza, and M. RuizRubio. 2003. The photolyase gene from the plant pathogen Fusarium oxyosporum f. sp. lycopersici is induced by visible light and α-tomatine from tomato plant. Fungal Genet. Biol. 40:159-165. - PubMed
    1. Ballario, P., P. Vittorioso, A. Magrelli, C. Talora, A. Cabibbo, and G. Macino. 1996. White collar-1, a central regulator of blue light responses in Neurospora, is a zinc finger protein. EMBO J. 15:1650-1657. - PMC - PubMed
    1. Berrocal-Tito, G., T. Rosales-Saavedra, A. Herrera-Estrella, and B. Horwitz. 2000. Characterization of blue-light and developmental regulation of the photolyase gene phr1 in Trichoderma harzianum. Photochem. Photobiol. 71:662-668. - PubMed
    1. Berrocal-Tito, G., L. Sametz-Baron, K. Eichenberg, B. A. Horwitz, and A. Herrera-Estrella. 1999. Rapid light regulation of a Trichoderma harzianum DNA photolyase gene. J. Biol. Chem. 274:14288-14294. - PubMed

Publication types

MeSH terms

LinkOut - more resources