. 2007 Aug;73(15):4797-804.
doi: 10.1128/AEM.00404-07. Epub 2007 Jun 1.

Quantitative analysis of population heterogeneity of the adaptive salt stress response and growth capacity of Bacillus cereus ATCC 14579

Affiliations

Quantitative analysis of population heterogeneity of the adaptive salt stress response and growth capacity of Bacillus cereus ATCC 14579

Heidy M W den Besten et al. Appl Environ Microbiol. 2007 Aug.

Abstract

Bacterial populations can display heterogeneity with respect to both the adaptive stress response and growth capacity of individual cells. The growth dynamics of Bacillus cereus ATCC 14579 during mild and severe salt stress exposure were investigated for the population as a whole in liquid culture. To quantitatively assess the population heterogeneity of the stress response and growth capacity at a single-cell level, a direct imaging method was applied to monitor cells from the initial inoculum to the microcolony stage. Highly porous Anopore strips were used as a support for the culturing and imaging of microcolonies at different time points. The growth kinetics of cells grown in liquid culture were comparable to those of microcolonies grown upon Anopore strips, even in the presence of mild and severe salt stress. Exposure to mild salt stress resulted in growth that was characterized by a remarkably low variability of microcolony sizes, and the distributions of the log(10)-transformed microcolony areas could be fitted by the normal distribution. Under severe salt stress conditions, the microcolony sizes were highly heterogeneous, and this was apparently caused by the presence of both a nongrowing and growing population. After discriminating these two subpopulations, it was shown that the variability of microcolony sizes of the growing population was comparable to that of non-salt-stressed and mildly salt-stressed populations. Quantification of population heterogeneity during stress exposure may contribute to an optimized application of preservation factors for controlling growth of spoilage and pathogenic bacteria to ensure the quality and safety of minimally processed foods.


Figures

FIG. 1.
FIG. 1.
Growth of Bacillus cereus ATCC 14579 in BHI broth without addition of salt (a) or with addition of 2.5% salt (b) or 5% salt (c) at 30°C. Viable cells were plated on BHI agar plates (□), BHI agar plates with the addition of 2.5% salt (▵), and BHI agar plates with the addition of 5% salt (*), and growth of individual microcolonies on Anopore strips placed upon BHI agar plates was determined without addition of salt (d) or with the addition of 2.5% salt (e) or 5% salt (f) at 30°C. The areas of individual microcolonies per imaging time point were measured two-dimensionally in pixels and log10 transformed. Data points represent the average microcolony size per imaging time point (○). For the 5% salt stress condition, the data points represent the average microcolony sizes of the growing population only. The specific growth rates were estimated by linear regression using the time points that represented exponential growth (continuous line).
FIG. 2.
FIG. 2.
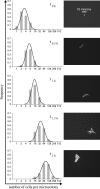
Example images of Bacillus cereus ATCC 14579 cultured on Anopore strips, which were placed upon BHI agar plates without addition of salt at 30°C. Observed and fitted frequency distributions of the number of cells per microcolony are shown for imaging time points (t) at 0, 0.5, 1, 1.5, and 2 h. The histograms show observed frequencies of numbers of cells per microcolony. Continuous curves show fitted normal distributions of the log10-transformed microcolony areas.
FIG. 3.
FIG. 3.
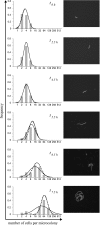
Example images of Bacillus cereus ATCC 14579 cultured on Anopore strips, which were placed upon BHI agar plates with the addition of 2.5% salt (wt/vol) at 30°C. Observed and fitted frequency distributions of the number of cells per microcolony are shown for imaging time points (t) at 0, 1, 1.7, 2.3, 3, and 3.7 h. Histograms show observed frequencies of numbers of cells per microcolony. Continuous curves show fitted normal distributions of the log10-transformed microcolony areas.
FIG. 4.
FIG. 4.
Example images of Bacillus cereus ATCC 14579 cultured on Anopore strips, which were placed upon BHI agar plates with the addition of 5% salt (wt/vol) at 30°C. Observed and fitted frequency distributions of the number of cells per microcolony are shown for imaging time points (t) at 0, 2.5, 4.5, 5.5, 6.5, and 7.5 h. Histograms show observed frequencies of numbers of cells per microcolony. Continuous curves show fitted normal distribution of the log10-transformed microcolony areas; solid lines represent the distribution of all microcolonies, and dashed lines represent the distribution of the growing microcolonies only.
FIG. 5.
FIG. 5.
Variances of the observed frequency distributions of the log10-transformed microcolony areas versus the imaging time points per salt stress condition. The intervals of imaging were 15, 20, and 30 min for conditions of non-salt stress (0%; □), mild salt stress (2.5%; ▵), and severe salt stress (5%; ⋄, distribution of all microcolonies, and ⧫, distribution of the growing microcolonies only).

Similar articles

Cited by

References

    1. Aertsen, A., K. Vanoirbeek, P. De Spiegeleer, J. Sermon, K. Hauben, A. Farewell, T. Nyström, and C. W. Michiels. 2004. Heat shock protein-mediated resistance to high hydrostatic pressure in Escherichia coli. Appl. Environ. Microbiol. 70:2660-2666. - PMC - PubMed
    1. Andersson, A., U. Rönner, and P. E. Granum. 1995. What problems does the food industry have with the spore-forming pathogens Bacillus cereus and Clostridium perfringens? Int. J. Food Microbiol. 28:145-155. - PubMed
    1. Anonymous. 2000. @Risk, advanced risk analysis for spreadsheets. Palisade Corp., Newfield, NY.
    1. Avery, S. V. 2006. Microbial cell individuality and the underlying sources of heterogeneity. Nat. Rev. Microbiol. 4:577-587. - PubMed
    1. Booth, I. R. 2002. Stress and the single cell: intrapopulation diversity is a mechanism to ensure survival upon exposure to stress. Int. J. Food Microbiol. 78:19-30. - PubMed

MeSH terms

LinkOut - more resources