. 2007 Jul;8(7):732-42.
doi: 10.1038/ni1474. Epub 2007 Jun 3.

Comprehensive epigenetic profiling identifies multiple distal regulatory elements directing transcription of the gene encoding interferon-gamma

Affiliations

Comprehensive epigenetic profiling identifies multiple distal regulatory elements directing transcription of the gene encoding interferon-gamma

Jamie R Schoenborn et al. Nat Immunol. 2007 Jul.

Erratum in

  • Nat Immunol. 2007 Aug;8(8):893. Stamatoyonnapoulos, John A [corrected to Stamatoyannopoulos, John A]
  • Nat Immunol. 2008 Jan;9(1):105

Abstract

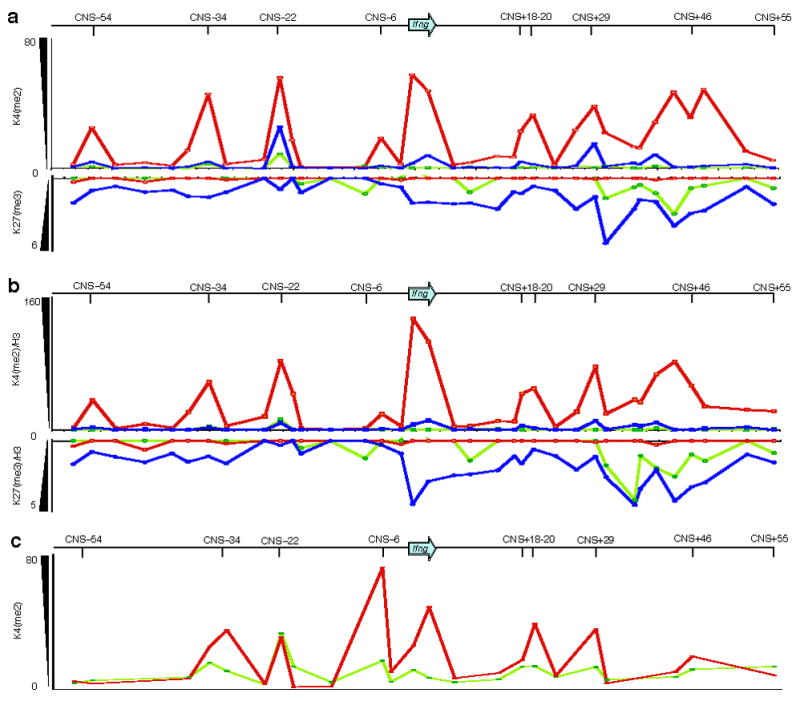
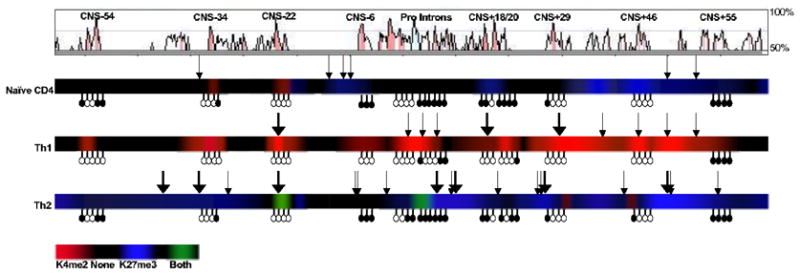
Unlike the well defined T helper type 2 cytokine locus, little is known about the regulatory elements that govern the expression of Ifng, which encodes the 'signature' T helper type 1 cytokine interferon-gamma. Here our evolutionary analysis showed that the mouse Ifng locus diverged from the ancestral locus as a result of structural rearrangements producing deletion of the neighboring gene encoding interleukin 26 and disrupting synteny 57 kilobases upstream of Ifng. Proximal to that disruption, we identified by high-resolution mapping many regions with CD4+ T cell subset-specific epigenetic modifications. A subset of those regions represented enhancers, whereas others blocked the activity of upstream enhancers or insulated Ifng from neighboring chromatin. Our findings suggest that proper expression of Ifng is maintained through the collective action of multiple distal regulatory elements present in a region of about 100 kilobases flanking Ifng.


Figures

Figure 1
Figure 1. Evolutionary conservation within the Ifng locus
Alignment of 600 kb flanking the Ifng gene on mouse chromosome 10 with sytenic regions of rat chromosome 7 and human chromosome 12 shown (a) in cartoon form or (b) as peaks of sequence conservation using the UCSC genome browser (http://genome.ucsc.edu/cgi-bin/hgGateway). (a) Genes are denoted by blue arrows, indicating the direction of transcription. The stippled arrow denotes Tmevpg1, an antisense, non-coding transcript. Red horizontal lines below the human and mouse chromosomes indicate the location of a complex segmental duplication in the mouse genome (mm8, C57BL/6), shown in greater detail in Supplementary Fig. 1. The blue hatched bar denoted as ΨIl26 represents sequences homologous to exon 5 of the human IL26 gene; orange bars indicate LINE and LTR-LINE-LTR insertions described in the text. (b) The inset at the bottom indicates the location of the ∼120 kb region surrounding Ifng shown in greater detail in (c), which displays conserved exons in turquoise and conserved non-coding sequences (CNSs) with ≥ 70% identify over ≥100 bp in red. Positions of CNSs relative to the start of murine Ifng are denoted below, and murine genome coordinates are shown at either end.
Figure 2
Figure 2. DNase HS profiling reveals lineage-specific changes in DNase hypersensitivity
Q-PCR was used to locate DNase HS sites in naïve, TH1 and TH2 cells. Genomic conservation and DNase HS sites are shown using the UCSC browser (http://genome.ucsc.edu/index.html?org=Mouse). Genome coordinates are indicated on the sides, conservation and LINE and LTR elements are shown along the bottom and the location of the CNSs are highlighted in yellow. Vertical peaks denote regions in which sensitivity to DNase digestion was ≥2.5 SD than the baseline, and peak heights represent the degree of hypersensitivity as numbers of SD. DNase HS sites are labeled based on their location relative to Ifng, except for sites I, II and III which are as named by Agarwal & Rao. Strong HS sites (DNase I sensitivity >4SD greater than the baseline are denoted HS; weak HS sites (DNase I sensitivity >2.5 SD but < 4SD) are denoted hs. DNase profiling was done in two or more independent experiments for each cell subset, and composite results are shown.
Figure 3
Figure 3. TH1 cells are marked by K4(me2), whereas naive and TH2 cells are characterized by enrichment of K27(me3)
(a) ChIP was used to detect enrichment of the permissive K4(me2) modification, which appears as upward-pointing peaks (top), or enrichment of the repressive K27(me3) mark, which appears as downward-pointing peaks (bottom), in naïve CD4 (light green) and in vitro generated TH1(dark red) and TH2 cells (blue). (b) Enrichment of K4(me2) and K27(me3) was normalized to total histone H3 to account for possible differences in nucleosome density or structure between cell types. (c) ChIP for K4(me2) in naïve CD4 and TH1 effectors generated in vivo following adoptive transfer into congenic mice and infection with LCMV-Armstrong. Enrichment values are arbitrary units as defined in the methods. Data are representative of three independent experiments for (a) and (b) and two independent experiments for (c).
Figure 4
Figure 4. CD4+ T cell subset-specific CpG methylation at the Ifng locus
Methylation of CpGs in the Ifng (a) or the Il4Il13 locus (b). CNS regions analyzed by bisulfite treatment and sequencing of cloned alleles (individual rows) are denoted at the top. Closed circles represent meCpG, open circles represent CpG. Numbers and percentage of unmethylated CpG are below each region. CpG methylation patterns from purified hepatocytes are shown as an IFN-γ non-expressing cell control. Data represent 2–4 independent experiments. For IfngCNS+55, CpG methylation was evaluated in its most distal portion centered at +59kb.
Figure 5
Figure 5. Epigenetic profile of naive, TH1 and TH2 CD4+ T cells
Composite pattern of DNase HS sites (shown as downward arrows), K4(me2)/H3 (red) and K27(me3)/H3 (blue) shown as a heatmap, and methylated or unmethylated CpGs shown as filled or open lollipops, respectively, with conservation shown above in VISTA format.
Figure 6
Figure 6. IfngCNS–6 and IfngCNS+29 enhance IFN-γ production in the absence of T-bet, whereas IfngCNS–22 and IfngCNS–34 are T-bet-dependent enhancers
EL-4 cells were co-transfected with a plasmid containing the 9 kb Ifng gene (−3.4 to +5.6 kb) alone or also containing the indicated CNS region, and either pcDNA3 (a) or pcDNA3 driving expression of T-bet (b) plus a β-actin Renilla luciferase transfection control plasmid. Cells were either not stimulated (unstim) or were stimulated with PMA and ionomycin for 24 h. IFN-γwas assessed by ELISA and normalized to luciferase activity (RLU). Results are mean ± SD of duplicate samples from one representative experiment of 4 or more independent experiments.
Figure 7
Figure 7. Ifng CNS elements enhance Ifng expression in NK cells and primary T cells
Luciferase reporter constructs containing the Ifng promoter and the indicated IfngCNSs were transfected into NK-92 cells (a) or primary CD8 (b), TH0 (c), or TH2 (d) T cells and expression was assessed by dual luciferase assay in cells that were not stimulated or were stimulated with IL-12 plus IL-18, PMA plus ionomycin (NK-92 cells) or anti-CD3 and anti-CD28 (T cells), or the combination of these stimuli. Normalized luciferase units are mean ± SD of duplicate samples from one representative experiment of 2–5 individual experiments; results with TH1 and TH0 cells were similar, and a representative TH0 experiment is shown.
Figure 8
Figure 8. Boundary element function of CNSs
EL-4 cells were transfected with constructs containing the neomycin-resistance gene under the control of the TCRδpromoter and enhancer and observed for colony formation in the presence of G418 (Neo). In assays for insulator activity, CNS regions were cloned upstream of the enhancer (a); in assays for enhancer-blocking activity, CNS regions were cloned between the enhancer and promoter (b). Data are a compilation of at least three experiments, each with triplicate transfections. The bar depicts means. ***, P ≤ 0.0001; **, P = 0.0002 for comparison to the β-neo control.

Comment in

References

    1. Ho IC, Glimcher LH. Transcription: tantalizing times for T cells. Cell. 2002;109(Suppl):S109–20. - PubMed
    1. Murphy KM, Reiner SL. The lineage decisions of helper T cells. Nat Rev Immunol. 2002;2:933–44. - PubMed
    1. Ansel KM, Lee DU, Rao A. An epigenetic view of helper T cell differentiation. Nat Immunol. 2003;4:616–23. - PubMed
    1. Szabo SJ, Sullivan BM, Peng SL, Glimcher LH. Molecular mechanisms regulating Th1 immune responses. Annu Rev Immunol. 2003;21:713–58. - PubMed
    1. Hwang ES, Szabo SJ, Schwartzberg PL, Glimcher LH. T helper cell fate specified by kinase-mediated interaction of T-bet with GATA-3. Science. 2005;307:430–3. - PubMed

Publication types

Substances