. 2007 Jun 4:4:37.
doi: 10.1186/1742-4690-4-37.

Human Polycomb group EED protein negatively affects HIV-1 assembly and release

Affiliations

Human Polycomb group EED protein negatively affects HIV-1 assembly and release

Dina Rakotobe et al. Retrovirology. .

Abstract

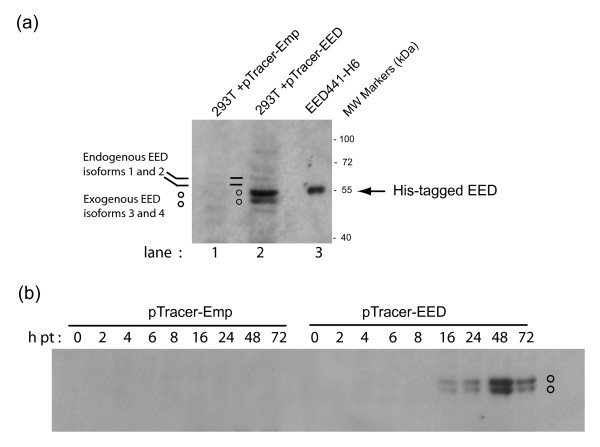
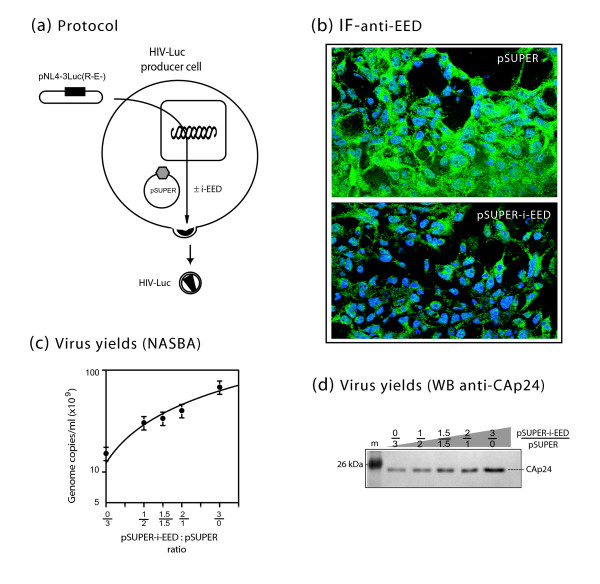
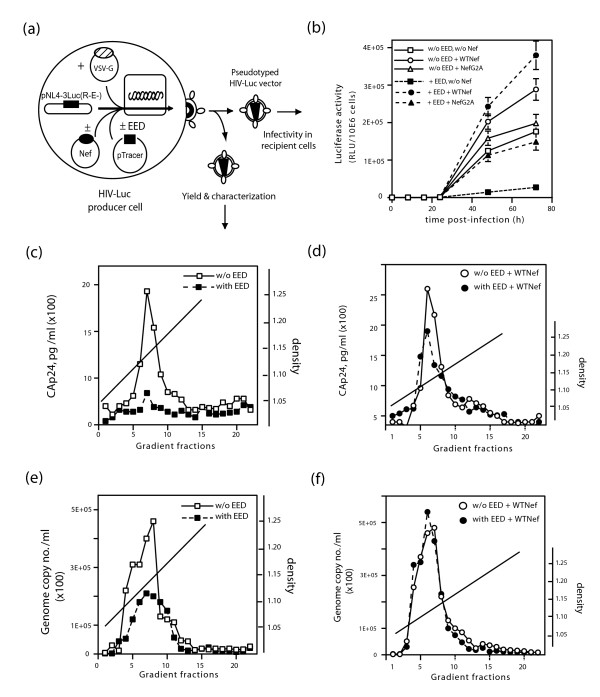
Background: The human EED protein, a member of the superfamily of Polycomb group (PcG) proteins with WD-40 repeats, has been found to interact with three HIV-1 components, namely the structural Gag matrix protein (MA), the integrase enzyme (IN) and the Nef protein. The aim of the present study was to analyze the possible biological role of EED in HIV-1 replication, using the HIV-1-based vector HIV-Luc and EED protein expressed by DNA transfection of 293T cells.

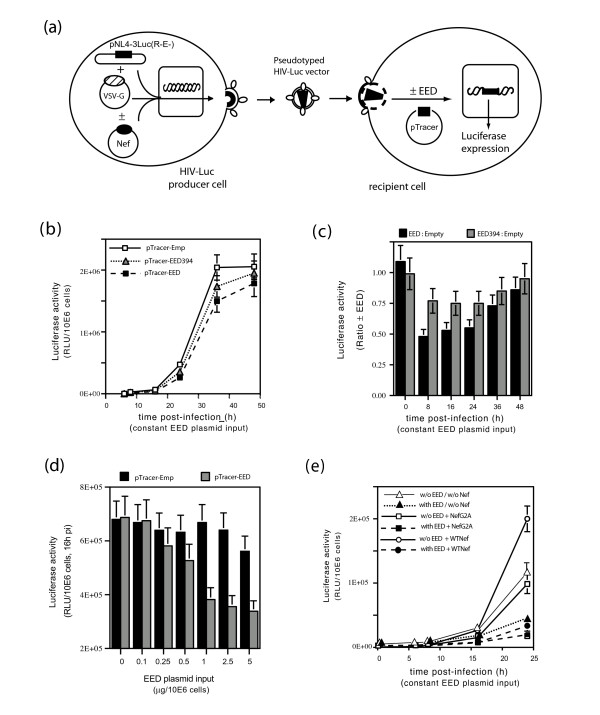
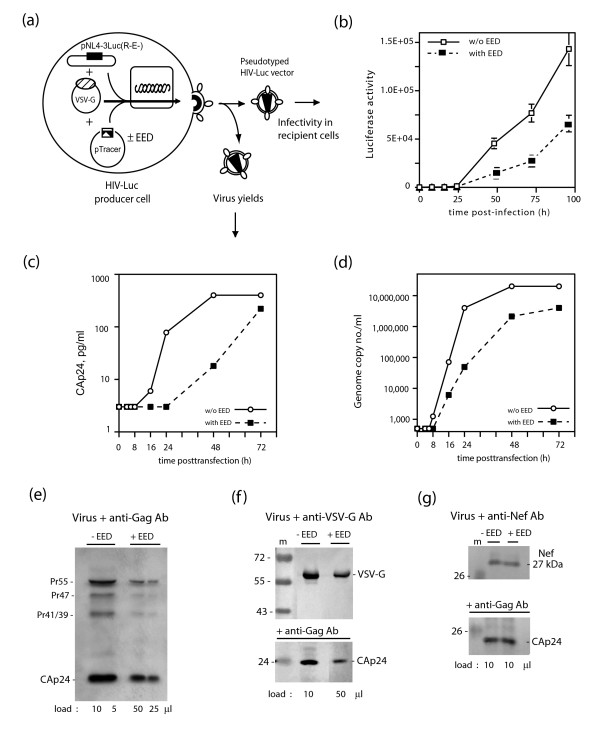
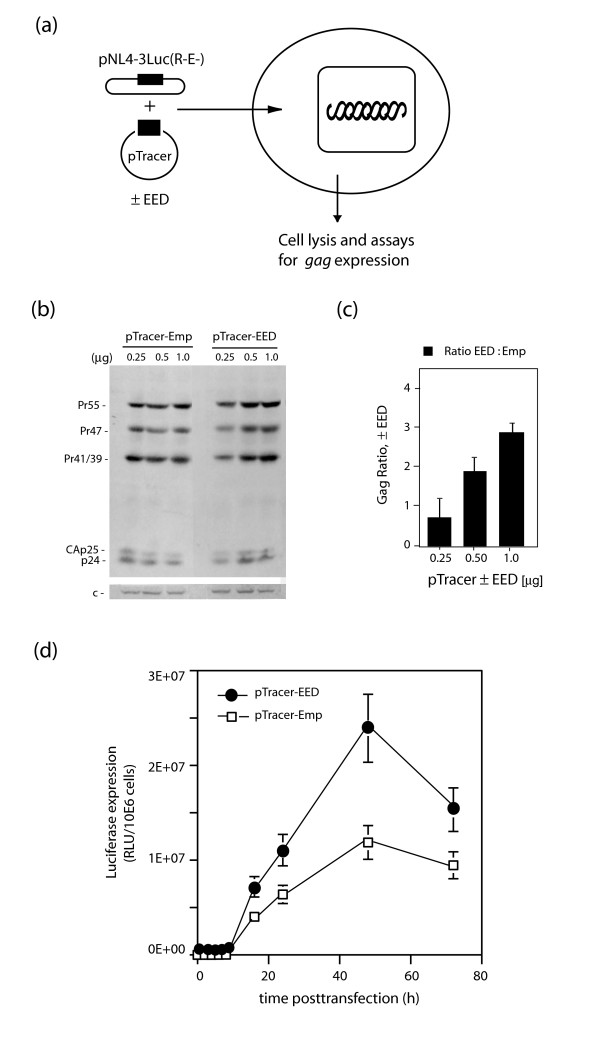
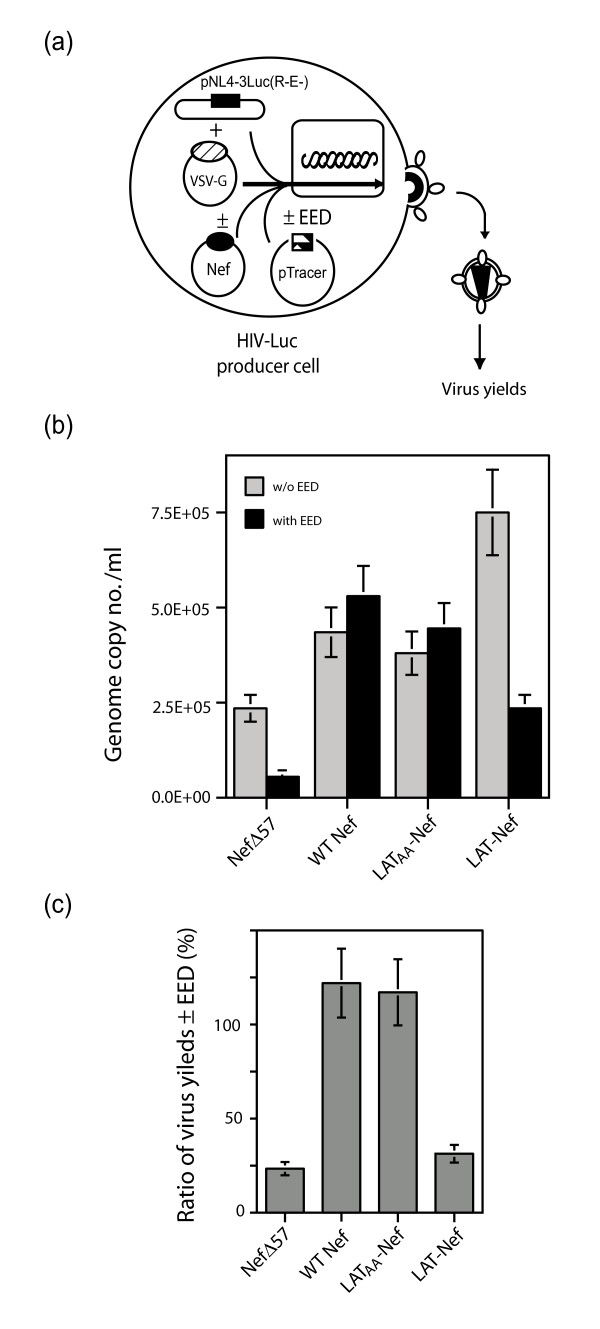
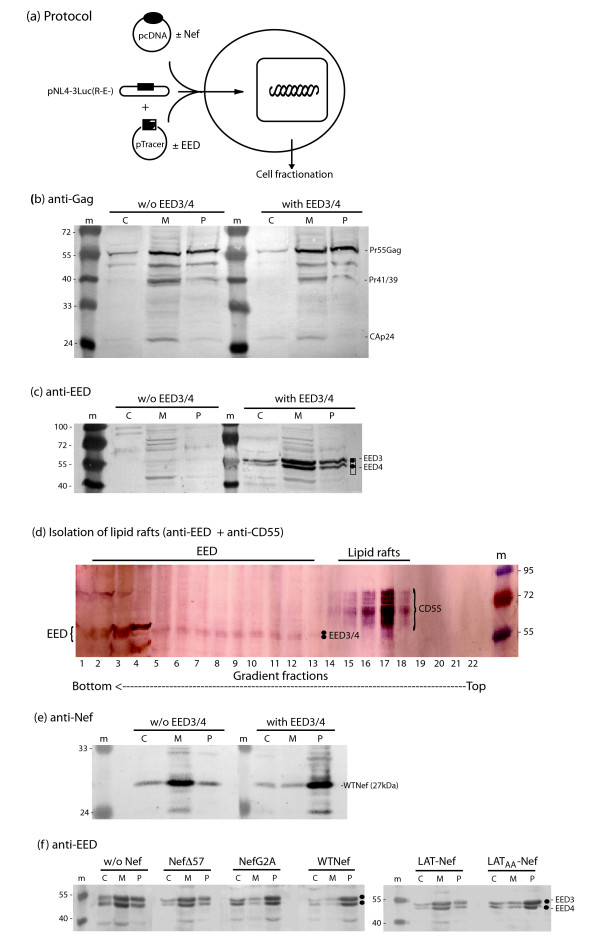
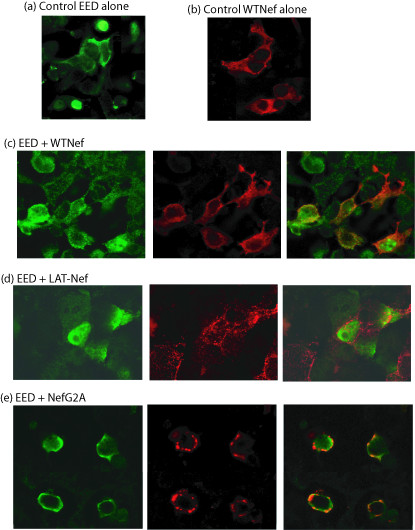
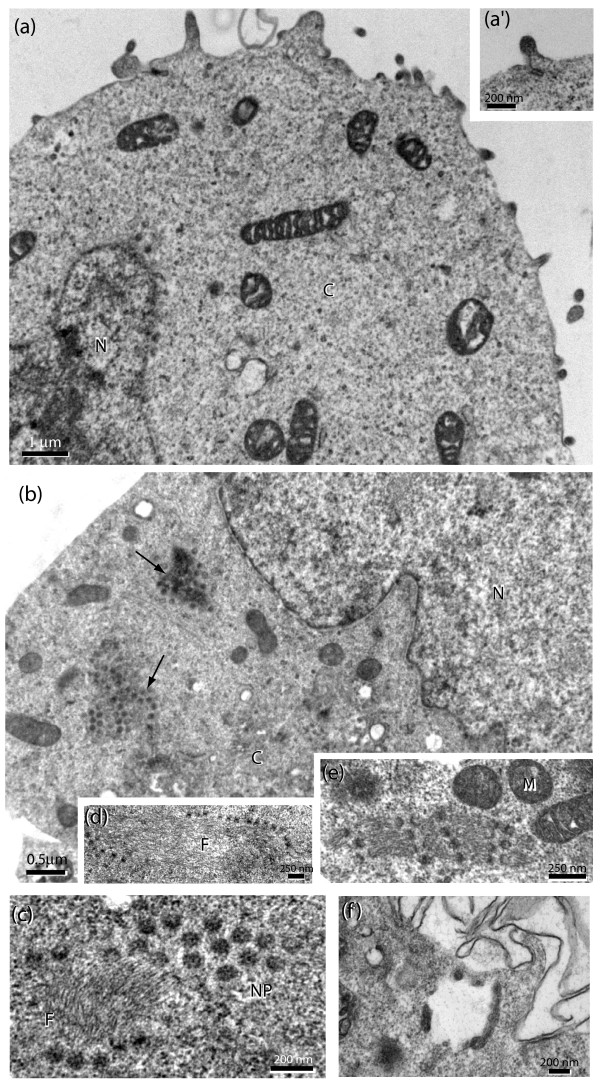
Results: During the early phase of HIV-1 infection, a slight negative effect on virus infectivity occurred in EED-expressing cells, which appeared to be dependent on EED-MA interaction. At late times post infection, EED caused an important reduction of virus production, from 20- to 25-fold as determined by CAp24 immunoassay, to 10- to 80-fold based on genomic RNA levels, and this decrease was not due to a reduction of Gag protein synthesis. Coexpression of WTNef, or the non-N-myristoylated mutant NefG2A, restored virus yields to levels obtained in the absence of exogenous EED protein. This effect was not observed with mutant NefDelta57 mimicking the Nef core, or with the lipid raft-retargeted fusion protein LAT-Nef. LATAA-Nef, a mutant defective in the lipid raft addressing function, had the same anti-EED effect as WTNef. Cell fractionation and confocal imaging showed that, in the absence of Nef, EED mainly localized in membrane domains different from the lipid rafts. Upon co-expression with WTNef, NefG2A or LATAA-Nef, but not with NefDelta57 or LAT-Nef, EED was found to relocate into an insoluble fraction along with Nef protein. Electron microscopy of HIV-Luc producer cells overexpressing EED showed significant less virus budding at the cell surface compared to control cells, and ectopic assembly and clustering of nuclear pore complexes within the cytoplasm.

Conclusion: Our data suggested that EED exerted an antiviral activity at the late stage of HIV-1 replication, which included genomic RNA packaging and virus assembly, resulting possibly from a mistrafficking of viral genomic RNA (gRNA) or gRNA/Gag complex. Nef reversed the EED negative effect on virus production, a function which required the integrity of the Nef N-terminal domain, but not its N-myristoyl group. The antagonistic effect of Nef correlated with a cellular redistribution of both EED and Nef.


Figures

Figure 1
Figure 1
Over-expression of EED3/4 isoforms in 293T cells. (a), SDS-PAGE and radioimmunoblot analysis of soluble fraction of 293T cell lysates after transfection with pTracer-Emp (lane 1) or pTracer-EED (lane 2) ; bacterially-expressed, histidine-tagged isoform 3 (EED441-H6; arrow) is shown in lane 3. (b), Kinetics of transient expression of exogenous EED3/4, using pTracer-EED versus control empty plasmid pTracer-Emp. Autoradiograms of blots reacted with anti-EED antibody and 35SLR-labeled anti-rabbit IgG antibody. Note that the endogenous EED proteins were barely detectable in soluble lysates from 293T cells, whereas exogenous EEDs were visible as a doublet band at 52 and 51 kDa, detectable as early as 16 h after transfection with a maximum at 48 h.
Figure 2
Figure 2
Antiviral effect of EED3/4 on incoming HIV-Luc virions. (a), Experimental protocol. (b), Time-course analysis of luciferase expression in 293T cells transfected with pTracer-EED, pTracer-EED394 (EED ST394AI mutant) or control pTracer-Emp at constant plasmid input (1 μg/106 cells), and infected with HIV-Luc vector. Luciferase activity, expressed as relative light units (RLU), was normalized to equal protein content. (c), Ratio of luciferase levels in cells expressing EED3/4 or EED394, versus control (pTracer-Emp). (d), Dose-response analysis of EED3/4 effect on luciferase expression.(e), Effect of the coexpression of WTNef or packaging-defective mutant NefG2A on EED antiviral activity. The discrete negative effect of EED on virus infectivity did not change when NefWT was provided in trans to virions in producer cells.
Figure 3
Figure 3
Influence of EED3/4 expression on virus yields. (a), Experimental protocol. (b), Virus infectivity. Virions produced by 293T cells transfected with pTracer-EED (filled symbols) or control pTracer-Emp plasmid (open symbols) were used to infect recipient 293T cells, and luciferase expression monitored at different times pi, as indicated. (c, d), Vector titer was determined by CAp24 immunoassay (c) or genomic RNA level (d). (e-g), SDS-PAGE polypeptide pattern of virus particles released from cells transfected with pTracer-EED (+EED) or control pTracer-Emp plasmid (-EED). Blots were reacted with anti-Gag (e; f, bottom panel ; g, bottom panel), anti-VSV-G (f, top panel) and anti-Nef (g, top panel) antibodies. Virus production was significantly reduced in the presence of EED, ranging from 20- to 25-fold at 24–48 h posttransfection, based on CAp24 immunoassay (c), to 10- to 80-fold, based on genomic RNA levels (d). The Gag protein composition (e), the VSV-G-to-CAp24 (f) and the Nef-to-CAp24 (g) ratios did not differ significantly between particles produced in the presence or absence of EED. Note that the load of virus samples produced in the presence of EED (e ; +EED) was 5-fold higher than control samples (-EED), and that coexpression of Nef restored the virus yields, as shown by CAp24 immunoblotting (g ; bottom panel).
Figure 4
Figure 4
Gag protein expression in EED3/4-expressing cells. (a), Experimental protocol. (b, c), Dose-response analysis of EED3/4 effect on gag gene expression in cells cotransfected with pNL4-3Luc(R-E-) and pTracer-EED (or control pTracer-Emp), at varying plasmid inputs (0.25 to 1 μg/106 cells). (b), Autoradiogram of SDS-PAGE and immunoblots reacted with anti-Gag antibody and 35SLR-labeled complementary antibody. Band c, 20-kDa cellular protein used as internal control for protein load. (c), Histogram of the ratios of total Gag proteins synthesized in the presence of pTracer-EED versus pTracer-Emp. (d), Time-course analysis of pNL4-3Luc(R-E-)-mediated luciferase expression in 293T cells co-transfected with pTracer-EED (filled symbols) or control pTracer-Emp plasmid (open symbols) at constant plasmid input (1 μg/106 cells). A slight increase in Gag protein synthesis was detected in the presence of EED, at plasmid inputs higher than 0.5 μg. A similar positive effect of EED (2- to 5-fold) on luciferase levels was observed between 18 and 72 h posttransfection.
Figure 5
Figure 5
RNA interference targeting endogenous EED. (a), Experimental protocol. 293T cells were transfected with a constant amount (3 μg/106cells) of a mixture of pSUPER + pSUPER-i-EED at various ratios of each plasmid, and posttransfected with pNL4-3Luc(R-E-) 24 h later. Virus yields were determined in culture medium after a further 48 h incubation. (b) Immunofluorescence (IF) signal of endogenous EED proteins in cells transfected with control pSUPER (upper panel) or pSUPER-i-EED (lower panel) at 3 μg/106cells each, and reacted with anti-EED antibody (1:200) and FITC-labeled conjugate(1:320). (c, d), Virion production was monitored by genomic RNA levels (c), and CAp24 immunoassays (d). Virus production increased in parallel with the decrease of EED signal and as a function of pSUPER-i-EED input, with a maximum of 4- to 5-fold over the control.
Figure 6
Figure 6
Antagonistic effect of Nef on EED. (a), Experimental protocol. Pelleted HIV-Luc vector particles produced by 293T cells transfected with pTracer-EED (filled symbols) or pTracer-Emp (open symbols), with or without Nef protein, WTNef or NefG2A mutant, were assayed for (b) vector infectivity, determined by luciferase activity in recipient cells, or (c-f) further analyzed by sucrose-D2O gradient ultracentrifugation. Gradient fractions were analyzed for (c, d) CAp24 titer, and (e, f) genomic RNA level. WTNef protein counteracted the negative effect of EED, and restored the virus production to control levels.
Figure 7
Figure 7
Effect of Nef mutants on EED. (a), Experimental protocol. HIV-Luc virions were produced by 293T cells transfected with pTracer-EED or pTracer-Emp, in the presence of various Nef proteins, WTNef, NefΔ57 mutant, or fusion constructs LAT-Nef or LATAA-Nef. Cell culture fluids were centrifuged and the amounts of virions in pellets quantified by genomic RNA levels. (b), Histogram of virion production in the presence of Nef without EED (grey bars) or EED with Nef (filled bars). (c), Ratio of virus yields in the presence versus the absence of EED, expressed as percentage. WTNef and LATAA-Nef showed the same EED antagonistic effect, whereas LAT-Nef and NefΔ57 mutants had a different phenotype.
Figure 8
Figure 8
Cellular distribution of EED3/4 upon NEF expression. (a), Experimental protocol. Cells were cotransfected with pNL4-3Luc(R-E-) and pTracer-EED (or pTracer-Emp), with or without coexpression of various Nef proteins, WTNef or NefG2A and NefΔ57 mutants, or fusion constructs LAT-Nef or LATAA-Nef, as indicated on top of each panel. Cells were fractionated into cytosolic supernatant (C), membrane fraction (M) and insoluble pellet (P), as shown in panels (b),(c),(e) and (f). Fractions were probed for (b) Gag, (c, d, f) EED, (e) Nef, and (d) CD55. (d), Isolation of lipid rafts by ultracentrifugation of flotation. Gradient fractions were analyzed by SDS-PAGE and immunoblotting, using anti-CD55 antibodies (detected by phosphatase-labeled complementary antibody) and anti-EED antibodies (detected by peroxidase-labeled complementary antibody). (m), Protein markers, with molecular masses indicated in kDa. Bands of exogenous EED3 and EED4 isoforms are indicated by black dots. Note that EED did not cosediment with lipid rafts, identified by the CD55 marker. Coexpression of EED and WTNef, NefG2A or LATAA-Nef, but not NefΔ57 or LAT-Nef, resulted in the relocation of EED and Nef proteins in a cellular compartment recovered as pelletable fraction (P).
Figure 9
Figure 9
Confocal fluorescence microscopy of 293T cells expressing EED alone (a) or WTNef alone (b), or co-expressing EED and various Nef proteins; (c),WTNef ;(d),LAT-Nef ;(e), NefG2A. The experimental protocol was as described in Fig. 8a. Left panels: anti-EED rabbit antibody and Alexa Fluor® 488-labeled goat anti-rabbit IgG ; middle panels: anti-Nef mAb and Alexa Fluor® 633-labeled goat anti-mouse IgG antibody; right panels: merged images. Note the absence of co-localization of EED and LAT-Nef, contrasting with the co-localization signals of EED and WTNef or NefG2A.
Figure 10
Figure 10
Electron microscopic analysis of 293T cells cotransfected with pNL4-3Luc(R-E-) and pTracer-Emp (a, and inset a') or pTracer-EED (b-f) at 3 μg each plasmid per 2 × 10⁶ cell sample, and harvested at 48 h posttransfection. (a), Control cells without exogenous EED expression. Note the number of viral particles budding at the cell surface. Inset (a'), Enlargement of one virus particle at an intermediate step of budding and egress. (b), EED3/4-expressing cells showing very rare budding events at the plasma membrane. Several clusters of ringlike structures (arrows) were observed in the cytoplasm, at distance from the nuclear envelope. Their dimensions (70–80 nm in overall diameter) and constitutive elements (electron-dense annular granules of 15–18 nm in diameter and central channel of 25–27 nm) were characteristic of nuclear pore complexes. (c-f), Enlargement of cytoplasmic areas from EED3/4-expressing cells showing clusters of nuclear pores (NP), viewed in tangential (c) or transversal (d, e) section, and in association with filaments arranged in bundles (F). (f), Cytoplasmic area of EED3/4-expressing cell showing intracytoplasmic vesicles at higher magnification. Note the local thickening of the vesicular membrane and the intraluminal budding of virus-like particles. N, nucleus ; C, cytoplasm ; M, mitochondria.

Similar articles

Cited by

References

    1. Ng J, Li R, Morgan K, Simon J. Evolutionary conservation and predicted structure of the Drosophila extra sex combs repressor protein. Mol Cell Biol. 1997;17:6663–6672. - PMC - PubMed
    1. Schumacher A, Faust C, Magnuson T. Positional cloning of a global regulator of anterior-posterior patterning in mice. Nature. 1996;383:250–253. doi: 10.1038/383250a0. - DOI - PubMed
    1. Schumacher A, Lichtarge O, Schwartz S, Magnusson T. The murine polycomb-group eed and its human orthologue: functional implications of evolutionary conservation. Genomics. 1998;54:79–88. doi: 10.1006/geno.1998.5509. - DOI - PubMed
    1. Simon J. Locking in stable states of gene expression: transcriptional control during Drosophila development. Curr Opin Cell Biol. 1995;7:376–385. doi: 10.1016/0955-0674(95)80093-X. - DOI - PubMed
    1. Sewalt RGAB, van der Vlag J, Gunster MJ, Hamer KM, den Blaauwen JL, Satijn DPE, Hendrix T, van Driel R, Otte AP. Characterization of interactions between the mammalian Polycomb-group proteins Enx1/EZH2 and EED suggests the existence of different mammalian Polycomb-group protein complexes. Mol Cell Biol. 1998;18:3586–3595. - PMC - PubMed

Publication types

MeSH terms

Substances