. 2007 Aug 3;282(31):22879-86.
doi: 10.1074/jbc.M702589200. Epub 2007 Jun 4.

The transition to an elongation complex by T7 RNA polymerase is a multistep process

Affiliations

The transition to an elongation complex by T7 RNA polymerase is a multistep process

Rajiv P Bandwar et al. J Biol Chem. .

Abstract

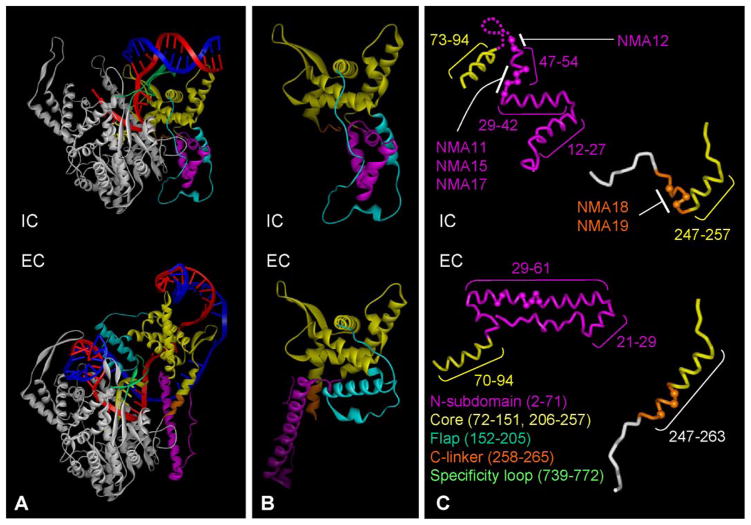
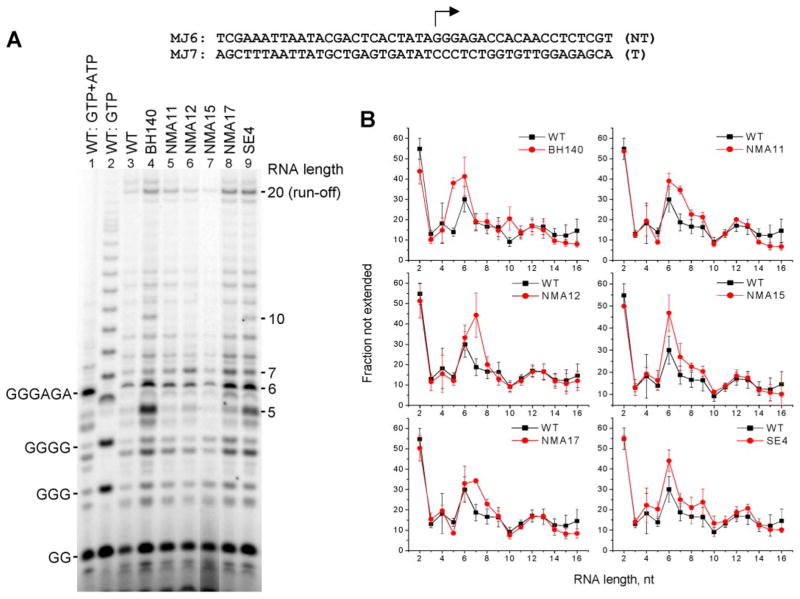
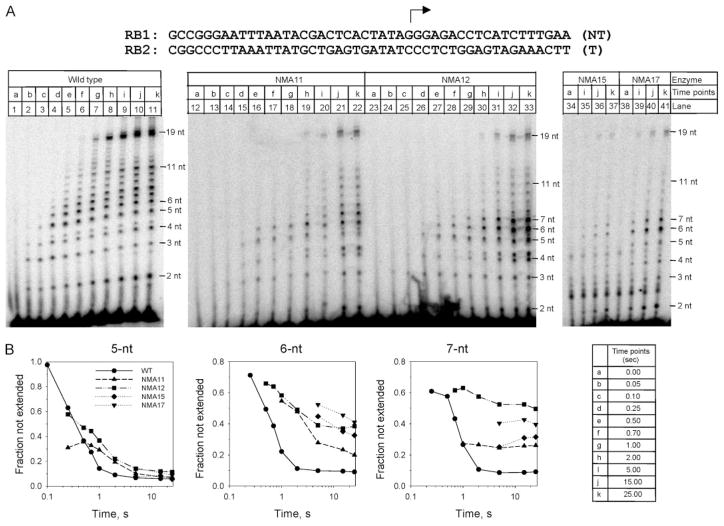
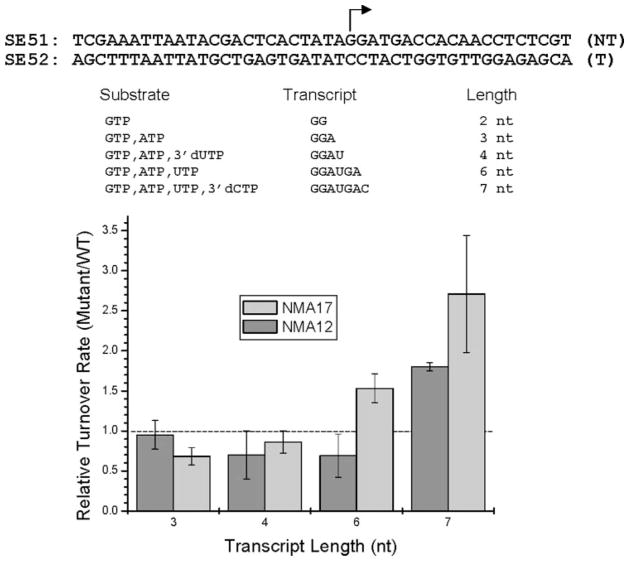
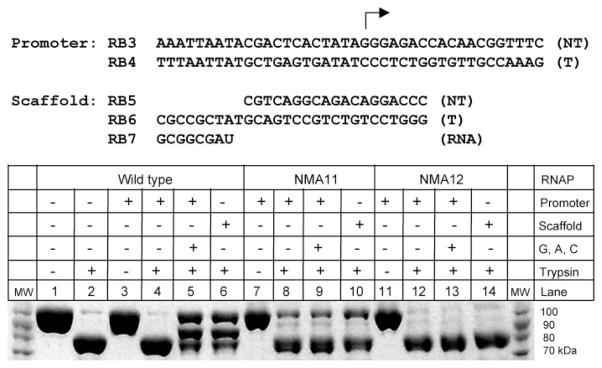
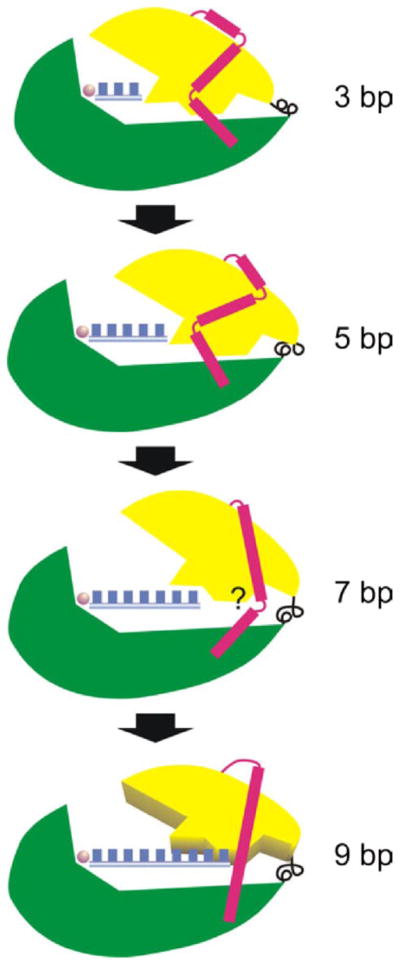
During the transition from an initiation complex to an elongation complex (EC), T7 RNA polymerase undergoes major conformational changes that involve reorientation of a "core" subdomain as a rigid body and extensive refolding of other elements in the 266 residue N-terminal domain. The pathway and timing of these events is poorly understood. To examine this, we introduced proline residues into regions of the N-terminal domain that become alpha-helical during the reorganization and changed the charge of a key residue that interacts with the RNA:DNA hybrid 5 bp upstream of the active site in the EC but not in the initiation complex. These alterations resulted in a diminished ability to make products >5-7 nt and/or a slow transition through this point. The results indicate that the transition to an EC is a multistep process and that the movement of the core subdomain and reorganization of certain elements in the N-terminal domain commence prior to promoter release (at 8-9 nt).


Figures

FIGURE 1
FIGURE 1. Reorganization of T7 RNAP during the transition to an EC
The α-carbon backbones of the T7 RNAP in the IC and the EC are presented as ribbons ( –10). The largely unchanged C-terminal domain is white; other elements that undergo rearrangement are color-coded as shown in the key at the bottom (amino acid residues are in parentheses). The T strand of the DNA is red, the NT strand is blue, and the nascent RNA is yellow. A, the structure of the IC and a model of the EC just prior to promoter release. The structures are aligned in the same orientation with regard to the unrearranged C-terminal domain. Note that in the EC, the core subdomain has rotated and translated as a rigid body and that other elements of the N-subdomain have become refolded. B, the organization of the N-terminal domain before and after the transition; elements are aligned with respect to the core subdomain. The core subdomain in the IC is shown in the same orientation as in panel A. Nucleic acids have been omitted for clarity. C, organization of the N-subdomain and the C-linker before and after the transition; the positions of mutagenized residues are depicted as spheres.
FIGURE 2
FIGURE 2. Mutations in the N-subdomain result in enhanced accumulation of products of 6–7 nt
A, the transcription template was formed by annealing MJ6 and MJ7 NT and T strand oligomers; the start site is indicated by the arrow. Transcription products (10-min reaction), labeled by incorporation of [γ-32P]GTP, were resolved by gel electrophoresis. Lane 1, RNAs formed in the presence of GTP and ATP by WT T7 RNAP. Lane 2, G-ladder formed by WT RNAP in the presence of GTP. Lanes 3–9, RNAs formed in the presence of all NTPs for WT and mutant RNAPs, as indicated (see Table 1 for a list of mutant enzymes). The exposure shown in lane 7 was adjusted to compensate for a lower activity in this sample. B, the fraction of products that are not extended for each transcript of length N is calculated as the amount of RNA of length N divided by the amount of products ≥ N (32). Error bars indicate the standard error of deviation from 2 to 4 independent experiments; the significance of the variance of the means for WT versus each mutant RNAP (Student’s t test) is p < 0.002 for the 5– 6-nt products synthesized by BH140 and SE4, and p < 0.05 for the 6 –7-nt products synthesized by NMA11–17 (except for synthesis of the 6-nt product by NMA17).
FIGURE 3
FIGURE 3. N-subdomain mutants show defects during the transition at 6–7 nt in a presteady state transcription assay
A, transcription was carried out in the presence of all four NTPs at 25 °C using a promoter template (RB1/RB2) that results in a 19-nt runoff product and WT or mutant T7 RNAPs, as indicated. Reactions were quenched with EDTA at various times, and the samples were analyzed by electrophoresis on a 23% polyacrylamide gel. For the time 0 sample, EDTA was added before the addition of NTPs. B, kinetics of extension of RNA to 5, 6, and 7 nt by WT and by mutant RNAPs. The fraction of RNA of length N unextended is calculated as in Fig. 2.
FIGURE 4
FIGURE 4. N-subdomain mutant RNAPs exhibit decreased stability when halted at 6–7 nt
Transcription assays (10 min) were carried out on template SE51/SE52 in the presence of restricted mixtures of substrate NTPs and/or 3′-dNTPs, resulting in synthesis of transcripts of 2–7 nt in length. The reactions were quenched with EDTA, and the products were resolved by electrophoresis in 25% polyacrylamide gels and quantified by PhosphorImager analysis. The rates for the accumulation of each product were then compared with that of the WT enzyme (value = 1.0) to give the relative turnover rate for complexes halted at each position (see chart). Each bar represents the average of three independent determinations. Standard deviations are noted. The significance of the variance of this value (Student’s t test) for WT versus mutant RNAPs for product lengths of 7 nt is p < 0.01.
FIGURE 5
FIGURE 5. N-subdomain mutants are defective in EC formation
WT and mutant T7 RNAPs were incubated with a promoter template (RB3/RB4) in the presence of GTP, ATP, and CTP to form an EC halted at 15 nt or a nucleic acid scaffold (RB5/RB6/RB7) that gives rise to an EC. The complexes were subjected to limited digestion with trypsin, and the products were analyzed by 4 –20% Tris-glycine SDS-PAGE. The sizes of protein molecular weight (MW) markers are shown in the margin.
FIGURE 6
FIGURE 6. Refolding of the N-subdomain during the transition to an EC
The schematic depicts the movement of the core subdomain (yellow) and refolding of the N-terminal subdomain (red) relative to the C-terminal domain (green) as the transcript length increases from 3 to 9 bp (blue boxes). The C-linker is black. Up to −5 bp movement of the core is apparently tolerated without a need to refold the N-subdomain. A transition at about 6 –7 bp appears to require refolding of at least some parts of the N-subdomain (e.g. the region associated with residues 45–55). Additional movement of the core is expected to occur up to promoter release (commencing at 9 bp) and the final transition to an EC.

References

    1. Straney DC, Crothers DM. J Mol Biol. 1987;193:279–292. - PubMed
    1. Carpousis AJ, Gralla JD. Biochemistry. 1980;19:3245–3253. - PubMed
    1. Milligan JF, Groebe DR, Witherell GW, Uhlenbeck OC. Nucleic Acids Res. 1987;15:8783–8798. - PMC - PubMed
    1. Martin CT, Muller DK, Coleman JE. Biochemistry. 1988;27:3966–3974. - PubMed
    1. Guo Q, Sousa R. J Biol Chem. 2005;280:14956–14961. - PubMed

Publication types