. 2007 Aug;51(8):2748-57.
doi: 10.1128/AAC.00090-07. Epub 2007 Jun 4.

Modulation of the cellular accumulation and intracellular activity of daptomycin towards phagocytized Staphylococcus aureus by the P-glycoprotein (MDR1) efflux transporter in human THP-1 macrophages and madin-darby canine kidney cells

Affiliations

Modulation of the cellular accumulation and intracellular activity of daptomycin towards phagocytized Staphylococcus aureus by the P-glycoprotein (MDR1) efflux transporter in human THP-1 macrophages and madin-darby canine kidney cells

Sandrine Lemaire et al. Antimicrob Agents Chemother. 2007 Aug.

Abstract

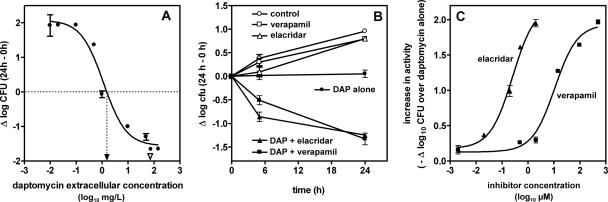
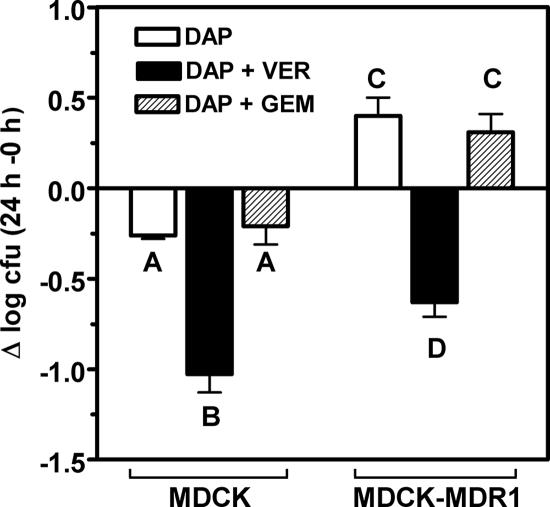
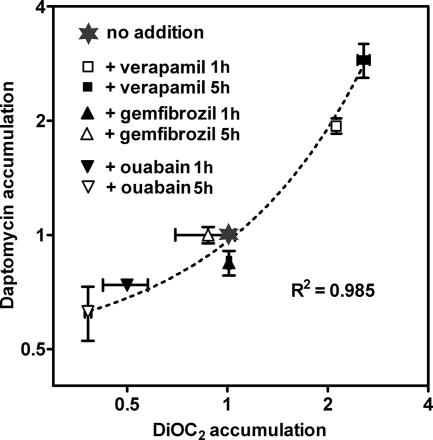
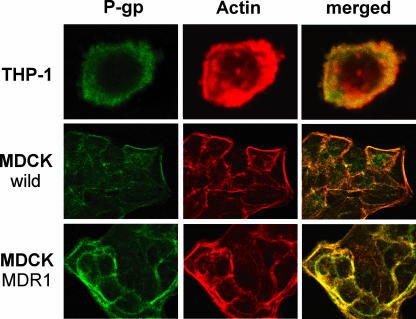
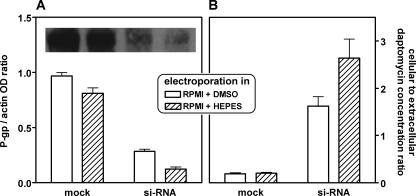
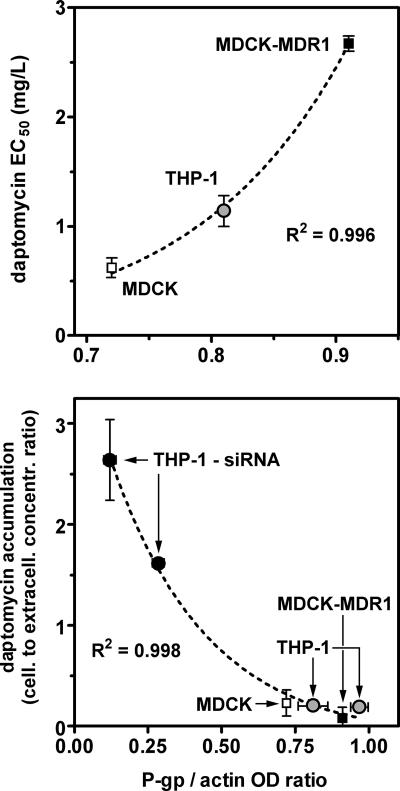
P-glycoprotein (P-gp; MDR1), a major efflux transporter, recognizes various antibiotics and is present in macrophages. We have examined its effect on the modulation of the intracellular accumulation and activity of daptomycin towards phagocytized Staphylococcus aureus (ATCC 25923) in human THP-1 macrophages, in comparison with MDCK epithelial cells (wild type and MDCK-MDR1 overexpressing P-gp; the bulk of the protein was immunodetected at the surface of all three cell types). Daptomycin displayed concentration-dependent intracellular activity (Hill equation pattern) in THP-1 and MDCK cells with (i) 50% effective drug extracellular concentration (EC(50); relative potency) and static concentrations at 9 to 10 times the MIC and (ii) maximal efficacy (E(max); CFU decrease at infinite extracellular drug concentration) at 1.6 to 2 log compared to that of the postphagocytosis inoculum. Verapamil (100 microM) and elacridar (GF 120918; 0.5 microM), two known inhibitors of P-gp, decreased daptomycin EC(50) (about threefold) in THP-1 and MDCK cells without affecting E(max). Daptomycin EC(50) was about three- to fourfold higher and accumulation in MDCK-MDR1 commensurately lower than in wild-type cells. In THP-1 macrophages, (i) verapamil and ATP depletion increased, and ouabain (an inducer of mdr1 [the gene encoding P-gp] expression) decreased the accumulation of daptomycin in parallel with that of DiOC(2) (a known substrate of P-gp); (ii) silencing mdr1 with duplex human mdr1 siRNAs reduced the cell content in immunoreactive P-gp to 15 to 30% of controls and caused an eight- to 13-fold increase in daptomycin accumulation. We conclude that daptomycin is subject to efflux from THP-1 macrophages and MDCK cells by P-gp, which reduces its intracellular activity against phagocytized S. aureus.


Figures

FIG. 1.
FIG. 1.
Intracellular activity of daptomycin towards S. aureus ATCC 25923 in THP-1 macrophages. (A) Dose-response curves over a wide range of extracellular concentrations. The ordinate shows the change in the number of CFU (Δ log CFU) per milligram of cell protein at 24 h compared to the postphagocytosis inoculum. A sigmoidal (slope factor, 1) function was used for regression (see Table 1 for goodness-of-fit and regression parameters). The dotted horizontal line indicates a static effect, which was reached for the extracellular concentration shown by the vertical dotted line. For reference, the open triangle on the abscissa indicates the serum Cmax (total drug) observed in volunteers receiving the clinically recommended dose of 4 mg/kg of body weight daptomycin (77 mg/liter) (67). (B) Influence of time and of the presence of efflux transporter inhibitors on the rate and the extent of the activity of daptomycin at a fixed extracellular concentration. The ordinate is as in panel A. Control, no treatment; DAP, daptomycin (1 mg/liter); verapamil (100 μM); elacridar (GF 120918; 0.5 μM). (C) Influence of the concentration of verapamil or elacridar on the activity of daptomycin (1 mg/liter) measured at 24 h. The ordinate shows the increase in activity defined as the difference between the change in CFU observed in the presence of the inhibitors minus what is observed with daptomycin alone (the graph shows the negative value of this difference to avoid describing increases in activity by decrements in the ordinate). All values are means ± standard deviations (n = 3; when not visible, the standard deviation bars are smaller than the symbols).
FIG. 2.
FIG. 2.
Activity of daptomycin at a fixed extracellular concentration (1 mg/liter) towards S. aureus ATCC 25923 in MDCK (wild-type) and MDCK-MDR1 (overexpressing P-gp) cells in 24 h. The ordinate shows the change in the number of CFU (Δ log CFU) per mg of cell protein. DAP, daptomycin alone; DAP + VER, daptomycin plus verapamil (100 μM); DAP + GEM, daptomycin plus gemfibrozil (250 μM). All values are means ± standard deviations (n = 3). Statistical analysis: values of bars with different letters are significantly different from each other (analysis of variance; P < 0.05).
FIG. 3.
FIG. 3.
Comparative modulation of the accumulation of daptomycin and DiOC2 in THP-1 macrophages by verapamil (100 μM), gemfibrozil (250 μM), or ouabain (1 μM). Cells were incubated with daptomycin (250 mg/liter) or DiOC2 (1 mg/liter) alone or in the presence of the modulators for 1 or 5 h. The graph shows the changes in accumulation of daptomycin (ordinate) and of DiOC2 (abscissa) expressed as the fraction of the respective values observed in the absence of the modulator. All values are means ± standard deviations (n = 3; when not visible, the standard deviation bars are smaller than the symbols). The dotted line shows the regression curve obtained by using an exponential growth function.
FIG. 4.
FIG. 4.
Immunohistodetection and localization of P-gp in THP-1 macrophages and in MDCK cells (wild type and MDCK-MDR1) by confocal microscopy. Formalin-fixed and saponin-permeabilized cells were exposed to mouse monoclonal anti-P-gp antibodies. Green channel, detection of mouse antibodies with goat fluorescein isothiocyanate-labeled anti-mouse antibodies; red channel, detection of actin with rhodamine-labeled phalloidin; merged images, the two labels are largely but not entirely colocalized.
FIG. 5.
FIG. 5.
Modulation of the cell content in P-gp and of daptomycin accumulation in THP-1 macrophages subjected to electroporation without (mock) or with duplex human mdr1 siRNAs in two different media (RPMI + DMSO, RPMI 1640 medium supplemented with 2.5% DMSO; RPMI + HEPES, RPMI medium supplemented with 25 mM HEPES). (A) Western blot analysis of lysates of cells collected 30 h after electroporation. The picture shows the bands corresponding to the protein as detected by mouse monoclonal anti-P-gp and polyclonal horseradish peroxidase-labeled anti-mouse antibody. The ordinate shows the absorbance ratio of the corresponding band in each condition to that of actin (not shown). OD, optical density. (B) Measurement of the apparent ratio of cellular to extracellular daptomycin concentration in cells incubated in drug-free medium for 30 h after electroporation and thereafter incubated for 24 h with 250 mg/liter daptomycin.
FIG. 6.
FIG. 6.
Correlations between the expression of P-gp (as determined by Western blot analysis and expression as the P-gp/actin optical density [OD] ratio as in Fig. 5) and (i) daptomycin intracellular relative potency and (ii) daptomycin cellular accumulation. (Top) Wild-type MDCK, THP-1, and MDCK-MDR1 cells; EC50 values (ordinate) are those listed in Table 1. (Bottom) Comparison between wild-type MDCK, MDCK-MDR1, and THP-1 cells and THP-1 cells subjected to mdr1 silencing (THP-1-siRNA); accumulation values (ordinate) are those listed in Table 2 and shown in Fig. 5; P-gp expression values (abscissa) are those of the top panel of this figure for MDCK, MDCK-MDR1, and THP-1 cells, and those of Fig. 5 for THP-1-siRNA cells. All values are means ± standard deviations (n = 3; when not visible, the standard deviation bars are smaller than the symbols). The dotted lines show the regression curve obtained by using exponential growth (top) or decay (bottom) functions.

Similar articles

Cited by

References

    1. Acharya, P., T. T. Tran, J. W. Polli, A. Ayrton, H. Ellens, and J. Bentz. 2006. P-glycoprotein (P-gp) expressed in a confluent monolayer of hMDR1-MDCKII cells has more than one efflux pathway with cooperative binding sites. Biochemistry 45:15505-15519. - PubMed
    1. Andrew, J. H., M. C. Wale, L. J. Wale, and D. Greenwood. 1987. The effect of cultural conditions on the activity of LY146032 against staphylococci and streptococci. J. Antimicrob. Chemother. 20:213-221. - PubMed
    1. Barcia-Macay, M., S. Lemaire, M. P. Mingeot-Leclercq, P. M. Tulkens, and F. Van Bambeke. 2006. Evaluation of the extracellular and intracellular activities (human THP-1 macrophages) of telavancin versus vancomycin against methicillin-susceptible, methicillin-resistant, vancomycin-intermediate and vancomycin-resistant Staphylococcus aureus. J. Antimicrob. Chemother. 58:1177-1184. - PubMed
    1. Barcia-Macay, M., C. Seral, M. P. Mingeot-Leclercq, P. M. Tulkens, and F. Van Bambeke. 2006. Pharmacodynamic evaluation of the intracellular activities of antibiotics against Staphylococcus aureus in a model of THP-1 macrophages. Antimicrob. Agents Chemother. 50:841-851. - PMC - PubMed
    1. Beauchamp, D., P. Gourde, M. Simard, and M. G. Bergeron. 1994. Subcellular distribution of daptomycin given alone or with tobramycin in renal proximal tubular cells. Antimicrob. Agents Chemother. 38:189-194. - PMC - PubMed

Publication types

Substances

LinkOut - more resources